Antonio Rutilio
Kintamani Resort investment
Opportunità Istituzionale

Kintamani Resort investment

Kintamani, Bali

Panoramica del Progetto

Lush tropical garden surrounding the Kintamani Resort villa

KINTAMANI RESORT

Project Description ​

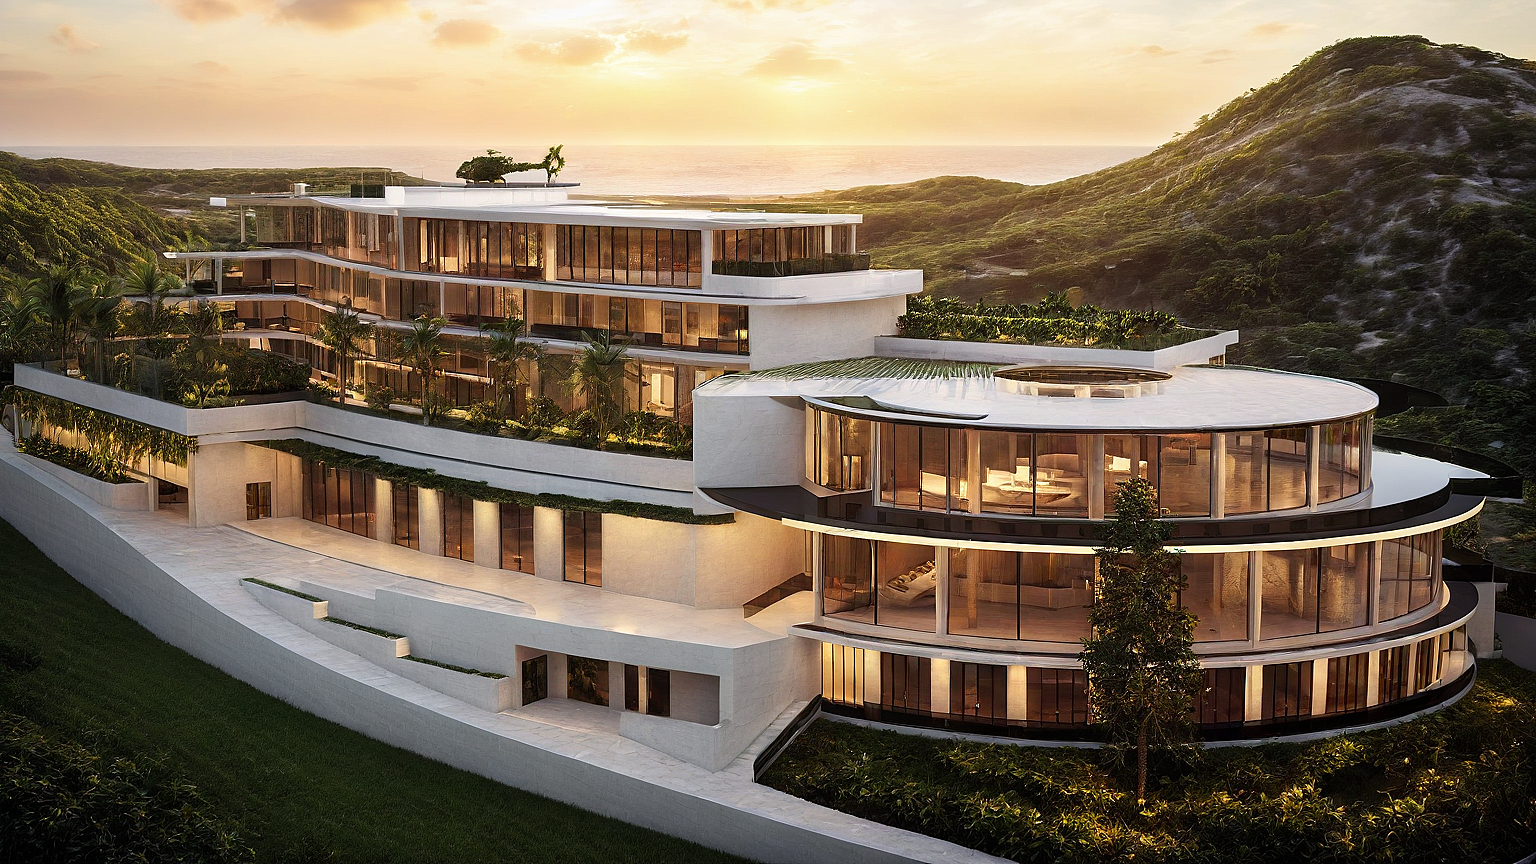
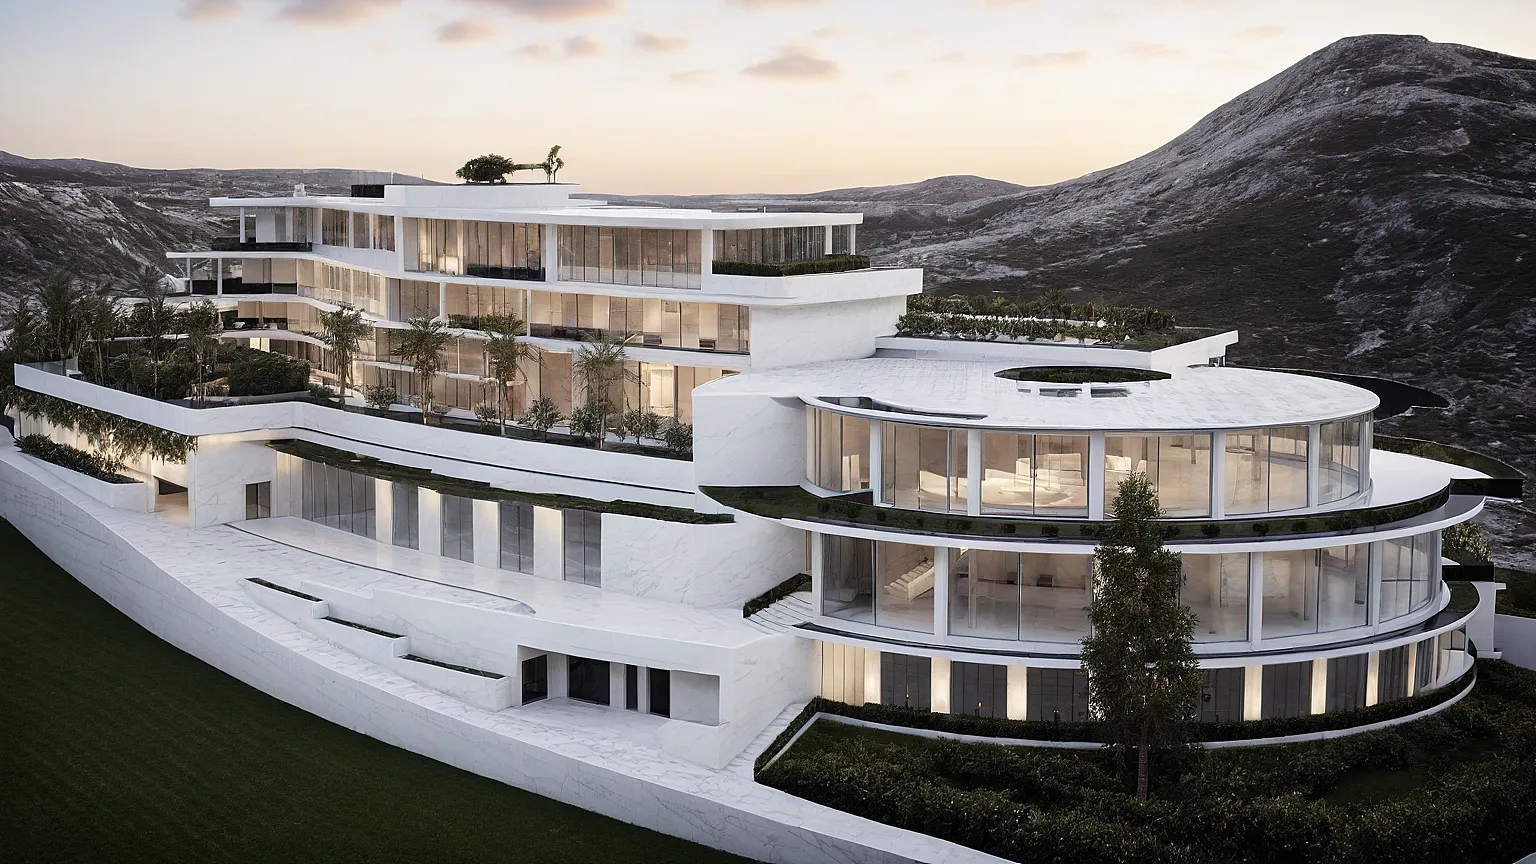
Nestled in the dramatic highlands of Kintamani, Bali, the Kintamani Resort is envisioned as a refined expression of contemporary tropical architecture. Designed by architect Antonio Rutilio, this project embraces the unique character of the volcanic terrain. Consequently, it creates a destination where modern design and natural beauty exist in perfect balance.

Architectural Concept & Vision

The design philosophy centers on total harmony with nature. Specifically, it creates a space that feels deeply connected to its environment while offering world-class luxury amenities. In addition, the architecture utilizes a refined palette of local materials, including volcanic rock and sustainable wood. As a result, these elements effectively anchor the structures within their natural setting and celebrate the raw textures of Bali.Moreover, large glass expanses and open-plan layouts characterize the resort. This approach ensures that every room offers an unobstructed view of the majestic mountains and the serene Lake Batur. Furthermore, this design approach maximizes the visual impact of the location while promoting natural ventilation.

Luxury Amenities and Indoor-Outdoor Living

Regarding the interior, the spaces focus on fluid transitions between indoor and outdoor living. For instance, spacious villas feature private infinity pools that appear to merge with the horizon. Meanwhile, communal areas are arranged to facilitate a sense of community and relaxation. Every element of the Kintamani Resort has been meticulously crafted to provide an unparalleled experience for discerning travelers. Because of this, luxury is woven into every detail from the elegantly appointed suites to the state-of-the-art spa. Ultimately, guests can enjoy a sanctuary that balances modern comfort with the untamed beauty of the highlands.
  • Client : Roman and Sergey

  • Date : September 2024 - November 2024

  • Project : Architectural, Interior & Exterior, and Rendering

Kintamani Resort Interior SuiteKintamani Resort TerraceKintamani ResortKintamani Resort Main Viewar_design_4_ar_designar_design_5_ar_designar_design_6_ar_designKintamani Resort GardenBack To Menu
Executive Summary
Investimento Target

€2,100k

Ingresso Minimo

€25k

ROI Target

25.40%

Proprietà

Concessione

Tabella di Marcia dello Sviluppo

Inizio Costruzioni Sep 2026
Apertura 01 Dec 2025
DESIGN E SVILUPPO
PERMESSI E LEGALE
COSTRUZIONE
PRE-APERTURA E LANCIO
Approfondimenti Istituzionali

Esploratore Analisi di Mercato

🔹 Domanda di Mercato
12% - 15%
Domestic elite, Asia-Pacific
25 Days
🔹 Dinamiche di Prezzo
€250
€130
€48.000
🔹 Vantaggio Competitivo
Local Glamping Sites
Low
Direct Crater View
🔹 Trend del Settore
Sustainable Travel
Medium
Medium
🔹 Strategia ed Exit
Wholesale Acquisition
Volcanic Activity
Moderate
Motore Dati Elite

Istantanea dell'Investimento

Simula i tuoi rendimenti regolando l'importo dell'investimento qui sotto.

💼 Mio Investimento (Simulatore)
Inserisci un valore per simulare
TIR Target

49.0%

Ricavi Stabilizzati

€2.2M

Margine EBITDA

50.0%

Orizzonte

5 Anni

Pareggio

Anno 4

Investimento Totale

€2.1M

📈 Rendimento Annuo Stimato

€49.000

Basato su un TIR del 49.0%
Simulatore Interattivo

Calcola il tuo Rendimento

Tua Quota Equity

0%

Quota di Proprietà
Reddito Passivo Annuo

€0

Rendimento Stabilizzato
Liquidità Proiettata (5A)

€0

Utili + Payout di Uscita
Multiplo di Uscita

0.0x

Fattore ROI Totale
Logica degli Scenari

Sensibilità del TIR (IRR)

PRUDENZIALE14%
CASO BASE22%
OTTIMISTICO30%
Analisi Strategica

Performance Finanziaria

Il progetto è concepito come un boutique resort a bassa densità e alto margine, ottimizzando sia il posizionamento di prezzo che l'efficienza operativa. I ricavi sono trainati dal posizionamento premium, dalle unità con vista oceano e dalla forte domanda di ospitalità esperienziale a Nusa Penida.

I costi operativi sono controllati attraverso un modello operativo snello e l'esternalizzazione selettiva dei servizi non core, garantendo la massima conversione verso l'EBITDA.

Dati di Mercato Fondamentali

Posizionamento di Mercato

Nusa Penida è una delle destinazioni in più rapida crescita a Bali, con una domanda crescente di alloggi di alto livello e focalizzati sul design.

Proprietà Comparabili
€110 ADR Medio
Domo Resort (Proiezione)
€310 ADR Obiettivo

Domo Resort è posizionato nel segmento superiore, sfruttando l'architettura, la location e l'esclusività per raggiungere livelli di ADR significativamente superiori alla media del mercato.

Apprezzamento del Capitale

Rendimenti e Strategia di Uscita

Il progetto punta a un margine EBITDA stabilizzato di circa il 40-45%, generando un flusso di cassa annuale costante. Gli investitori beneficiano di:

  • Distribuzione annuale degli utili a partire dal 2° anno
  • Forte apprezzamento del capitale attraverso la crescita del valore dell'asset
  • Struttura societaria ottimizzata fiscalmente per partner internazionali
Approccio Primario di Uscita L'uscita è prevista al 5° anno tramite vendita a un operatore alberghiero o a un acquirente istituzionale a un tasso di capitalizzazione (Cap Rate) proiettato del 9-10%.
Gestione del Rischio

Rischio e Mitigazione

Il progetto adotta un approccio finanziario prudente con ipotesi realistiche di occupazione e prezzo.

Bassa Densità

Riduzione della complessità operativa e dei costi fissi del personale.

Brand Forte

Identità architettonica distintiva a supporto di un ADR premium.

Ricavi Diversificati

Flussi di ricavo da alloggio, F&B e servizi benessere.

Sponsor Attivo

Coinvolgimento diretto dello sponsor nello sviluppo e nel controllo.

Disclaimer: Questo materiale è solo a scopo informativo e non costituisce un'offerta o una sollecitazione all'investimento. I dettagli vengono forniti su richiesta per partner qualificati.

Allocazione del Capitale (CAPEX)

Ripartizione dettagliata del budget per categoria

Questo grafico rappresenta la distribuzione strategica dell'investimento totale di €2.100.000. Le fasi di architettura, diritti fondiari e costruzione hanno la priorità per garantire la longevità dell'asset e un posizionamento premium.

Budget Dettagliato

Categoria Voce d'Investimento Importo
Land Acquisition Land Purchase €800.000
Construction Eco-Suite Structures €1.100.000
Others Risk Buffer €200.000
CAPITALE TOTALE STIMATO €2.100.000

Struttura dei Costi Operativi (OPEX)
PERSONALE E STAFF
€50.400
17.4% dei Ricavi
SERVICE STAFF
€85.000
29.4% dei Ricavi

Modellazione Dinamica dell'Investimento

Market Intelligence e Studio degli Scenari

Analisi di Redditività dell'Unità (2026)
Valori per singola unità/villa
RICAVI LORDI €35.588
OPEX E FEE STIMATE 47%
UTILE NETTO/UNITÀ €18.861
🍂 Indice di Stagionalità
Durata Alta Stagione 5 Mesi
Impatto Bassa Stagione -25% Vendite
⚙️ Operatività dell'Asset
32%
15%
€2,200

Queste cifre rappresentano benchmark istituzionali per la posizione e la classe di asset. La Modalità Scenario sposta queste variabili per simulare il rischio.

ANALISI ISTITUZIONALE

Previsione Finanziaria a 10 Anni

VALORE DI USCITA STIMATO (CASE BASE - ANNO 5)

€1.862.494

Cash Flow Cumulativo i
EBITDA Annuale i
Ricavi Target i
Mio Payout Stimato i
IRR PROIETTATO
--
Rendimento Interno Previsto
MULTIPLO DI EQUITY
--
Crescita Capitale Proiettata
PERIODO DI RECUPERO
--
Recupero Capitale Target
EBITDA STABILIZZATO
--
Utile Netto Stimato Anno 5
Nota: Valori stimati basati sullo scenario finanziario proiettato.
Ricavi Cumulativi

Reddito lordo totale generato durante il ciclo di vita del progetto.

Σ (ADR × Occ × Units × 365)
Cash Flow Cumulativo

Capitale netto rimanente dopo tutti i costi e il recupero dell'investimento.

Σ(Rev - Opex - Tax) - Inv
EBITDA Annuale

Performance operativa esclusi elementi non monetari e tasse.

Revenue - OPEX
Rendimento Investitore

Quota di utile netto attribuibile al tuo specifico investimento.

(CashFlow × My Inv) / Total
Break-even raggiunto nell'Anno 11.78

Recupero totale del capitale ottenuto prima della fase di stabilizzazione. Questo modello illustra un profilo rischio-rendimento equilibrato, con una forte generazione di flussi di cassa e una chiara cronologia di recupero del capitale.

Proiezione EBITDA e Ricavi a 10 Anni

Valori in Euro (€)

Analisi del Cash Flow

Rendimento Obiettivo 52.60%
Multiplo di Equity 2.20

Tabella Cash Flow Netto Annuale

Anno Occupazione Stimata Ricavi Lordi Utile Operativo (EBITDA) Cash Flow Netto
Year 1 45% €1.017.529 €356.135 €292.031
Year 2 60% €1.397.406 €558.962 €458.349
Year 3 85% €2.037.319 €916.793 €751.771
Year 4 87% €2.144.272 €1.029.251 €843.986
Year 5 85% €2.152.639 €1.076.319 €882.582
Year 6 85% €2.210.299 €1.105.149 €906.222
Year 7 85% €2.267.959 €1.133.979 €929.863
Year 8 85% €2.325.618 €1.162.809 €953.504
Year 9 85% €2.383.278 €1.191.639 €977.144
Year 10 85% €2.440.938 €1.220.469 €1.000.785
Crescita ADR

+3.50% Annuale

Crescita OPEX

+2.50% Annuale

Occupazione di Break-even

5.8% Obiettivo

Analisi di Sensibilità al Rischio

Matrice di Sensibilità (Analisi IRR)

Base Case: €250 @ 75%
ADR \ OCC 65% 70% 75% 80% 85%
€200 94.7% 101.6% 108.5% 115.5% 122.4%
€225 105.9% 113.7% 121.5% 129.3% 137.1%
€250 117.2% 125.9% 134.5% 143.2% 151.9%
€275 128.5% 138.0% 147.5% 157.1% 166.6%
€300 139.7% 150.1% 160.5% 170.9% 181.3%

Legal Disclaimer: This sensitivity analysis is based on historical market performance and projected operational standards in Nusa Penida. Actual results may vary depending on global tourism trends, local regulations, and macroeconomic factors. This is not a guarantee of future returns.

Restricted Access

Investor Documentation

Institutional Prospectus

Download the full technical and financial overview of the project.

Download Technical PDF
Elite Network

Private Deal Room

Exclusively available to authorized investors.

Register to Access
Asset Discussion
Live
ANTONIO RUTILIO Final architectural refinements on the Master Villa are now complete.
PARTNER Excellent. Reviewing the updated ROI pro-forma now.
Connettività Geografica

Logistica e Percorso dell'Investitore

Vedi su Google Maps Analisi di Accesso Globale
Legenda Percorso
Connessione Aerea
Strada / Autostrada
Via Mare (Ferry)
Connectivity Guide 2 STEPS
Airport Arrival
Air
15 min
Kintamani High-Road
Road
2h 15min (72 km)
Total Travel ~ €45
Infrastructure Active
Lifestyle & Exploration

Local Attractions & POIs

Surroundings Analysis
Highlight Destinations

No POIs added yet. Add them in the admin "Points of Interest" tab.

Local Gems

Discover the best spots within minutes of your doorstep.

Geographic Connectivity

Logistics & Connectivity Hub

Coords: -8.243546, 115.36789
Proximity Benchmarks
Nearest Intl Airport Analysis Pending
Coastline / Beach Direct Access
Nearest Harbor / Port Analyzing Hub
Road Infrastructure Paved Access
Medical Center Local Clinic nearby
Education Hubs N/A
Infrastructure Status
Connectivity Standard mobile
Grid Reliability Stable (Public Grid)
Supply Chain Regional Logistics
Strategic Overlay

Analyzing local development trends and infrastructure roadmap...