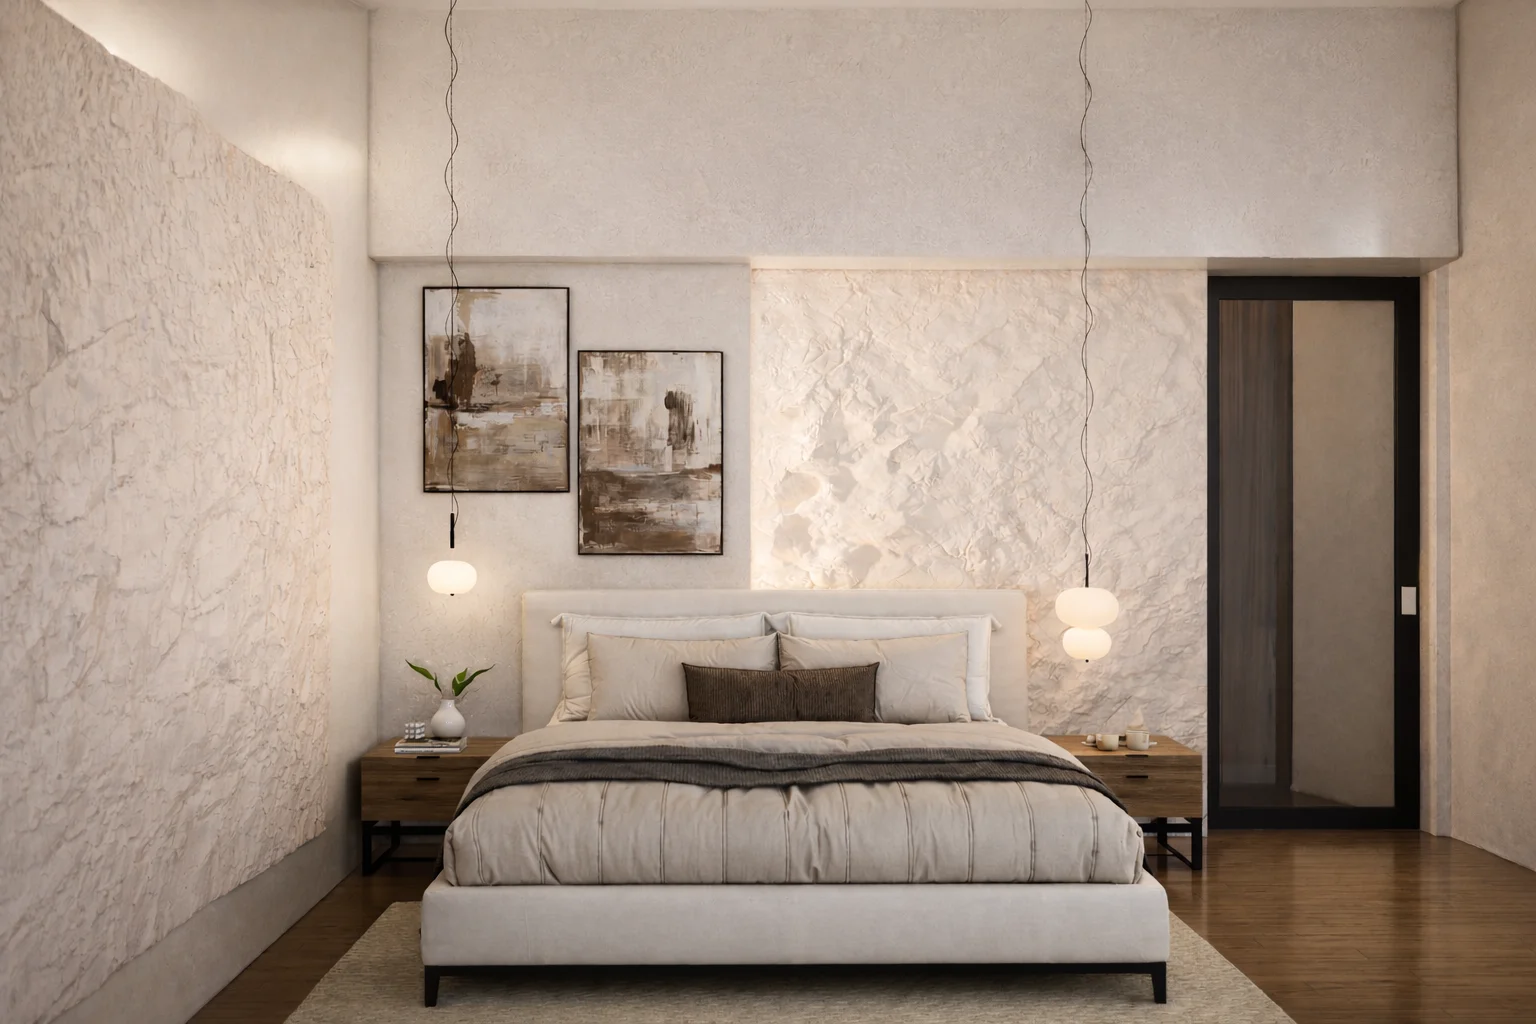
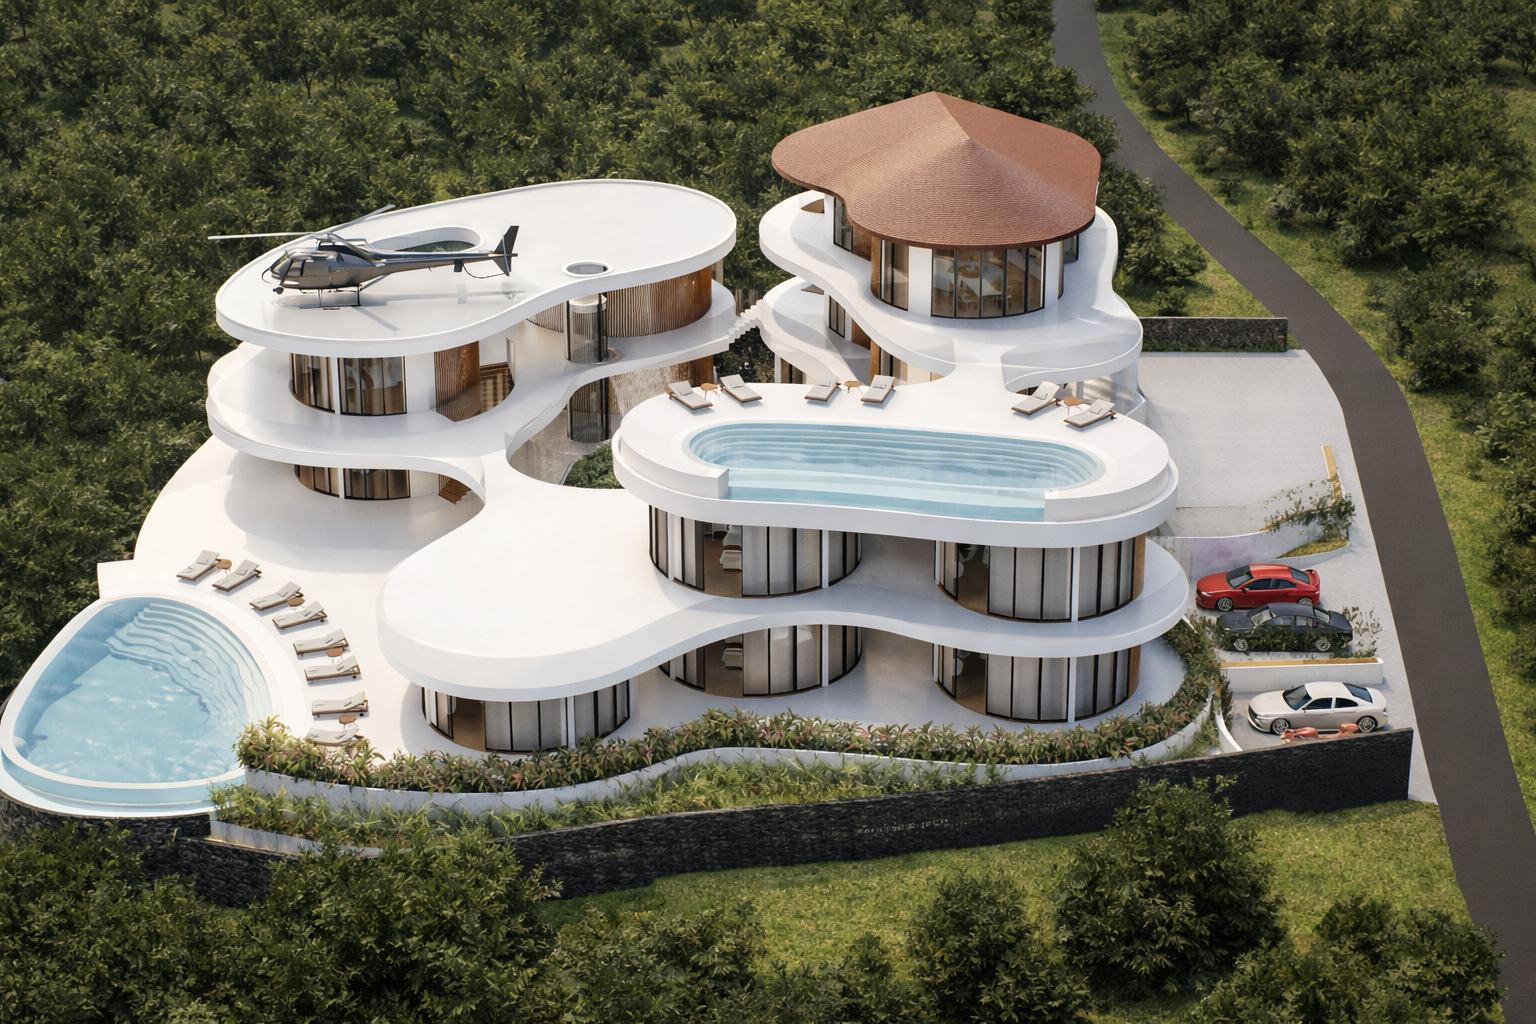
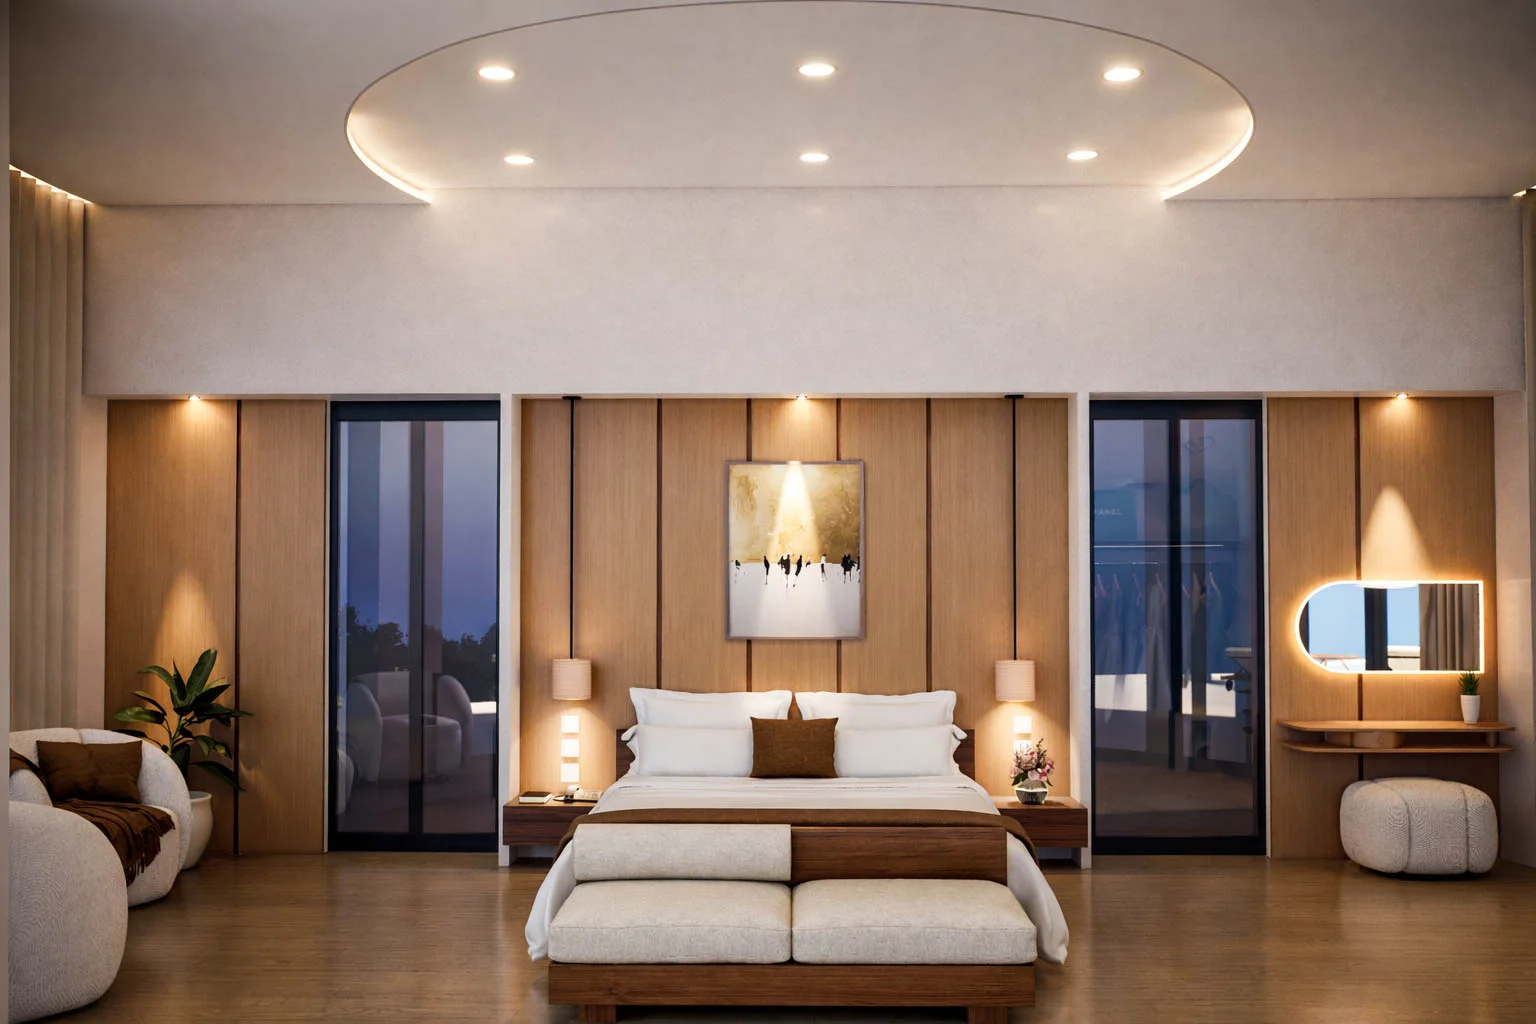
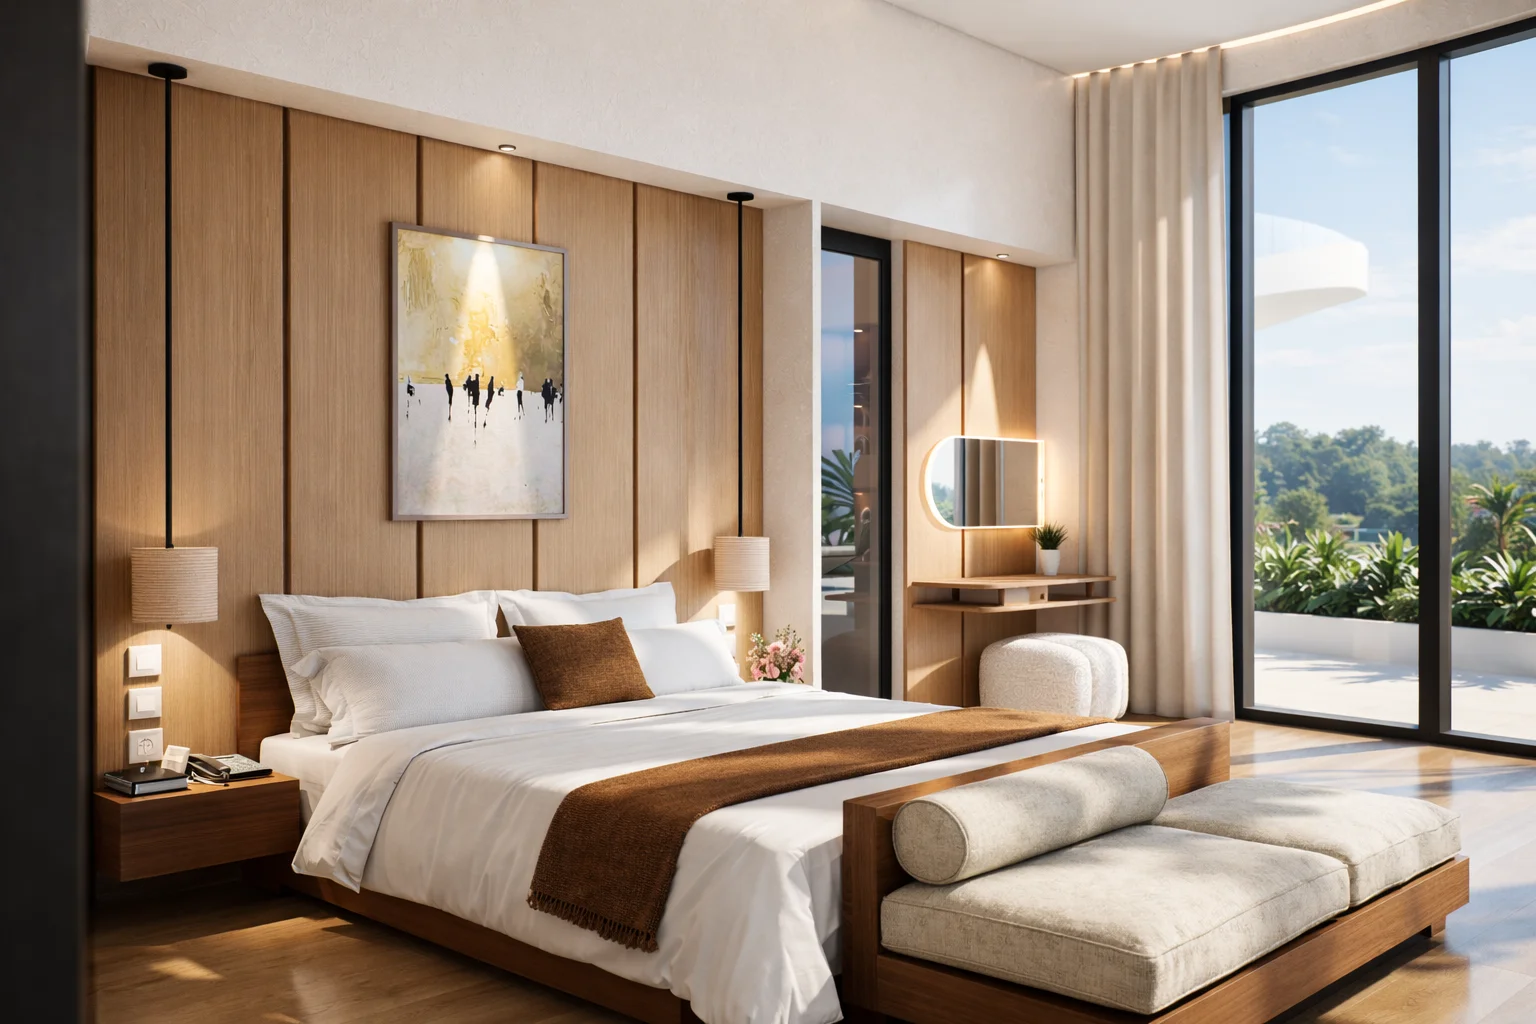
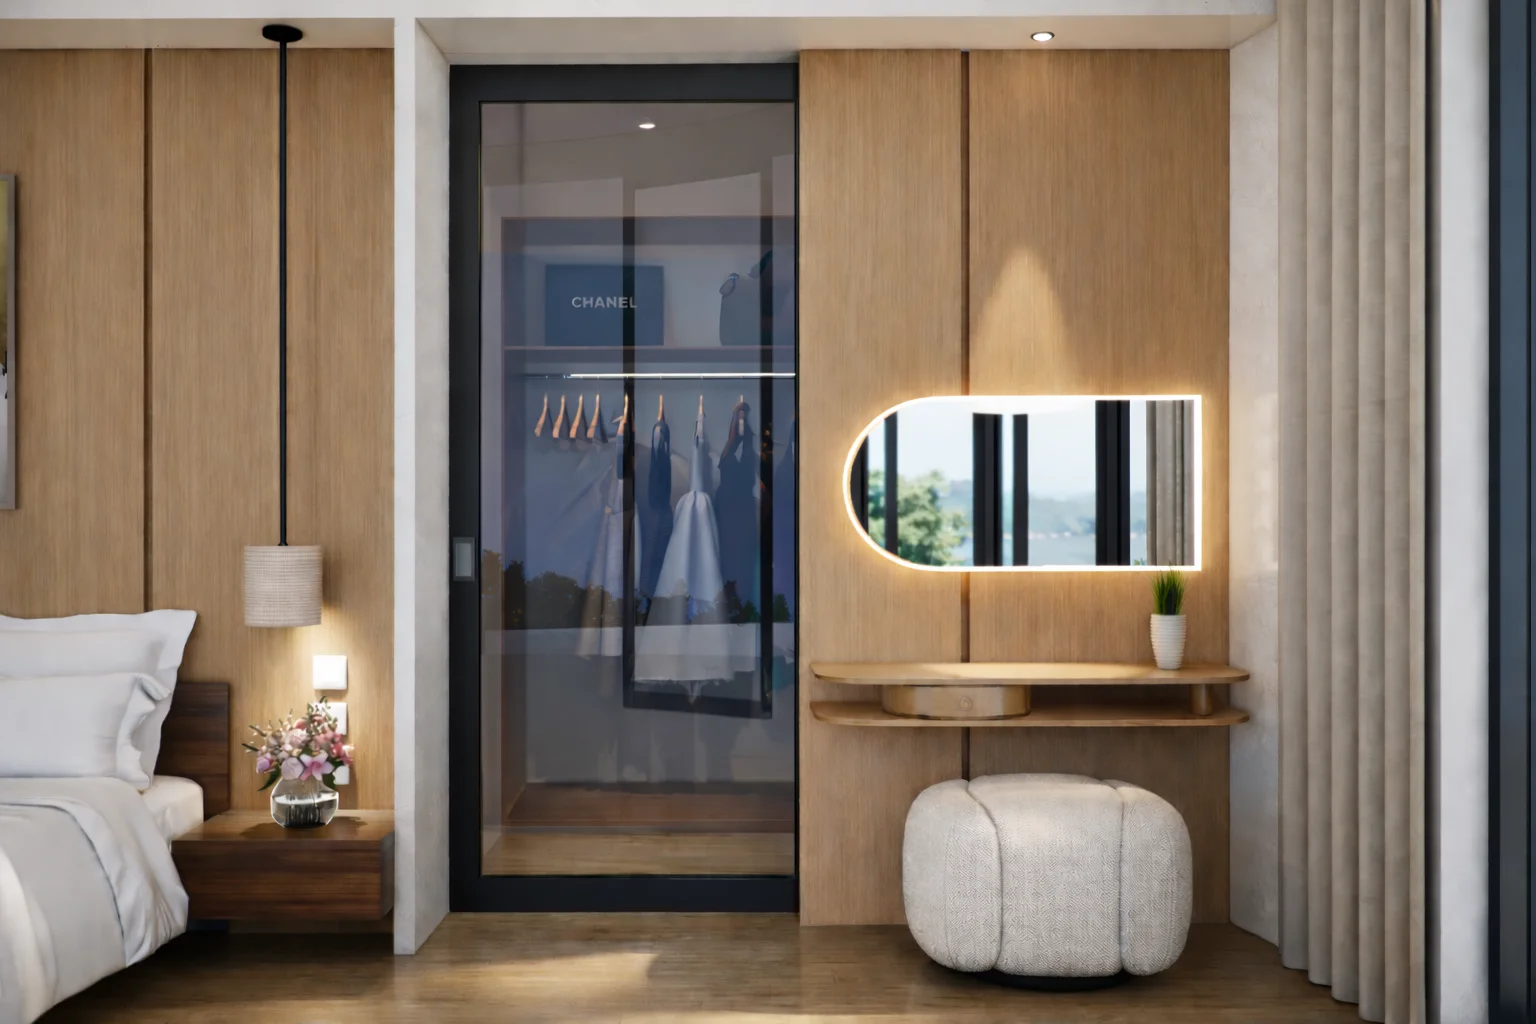
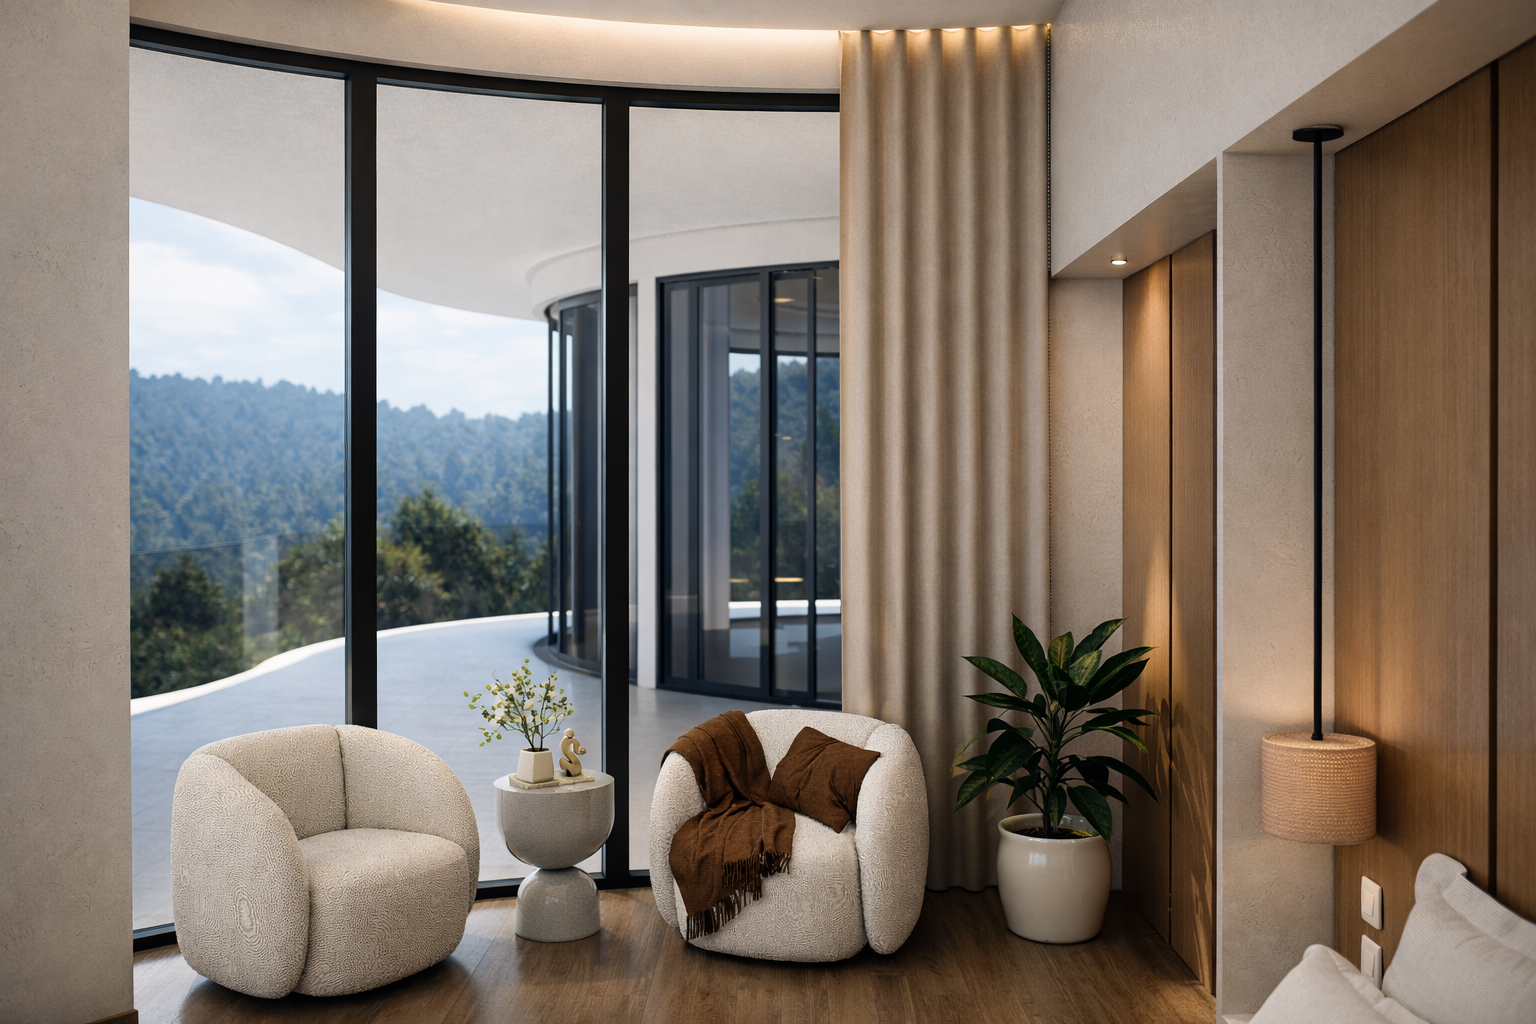
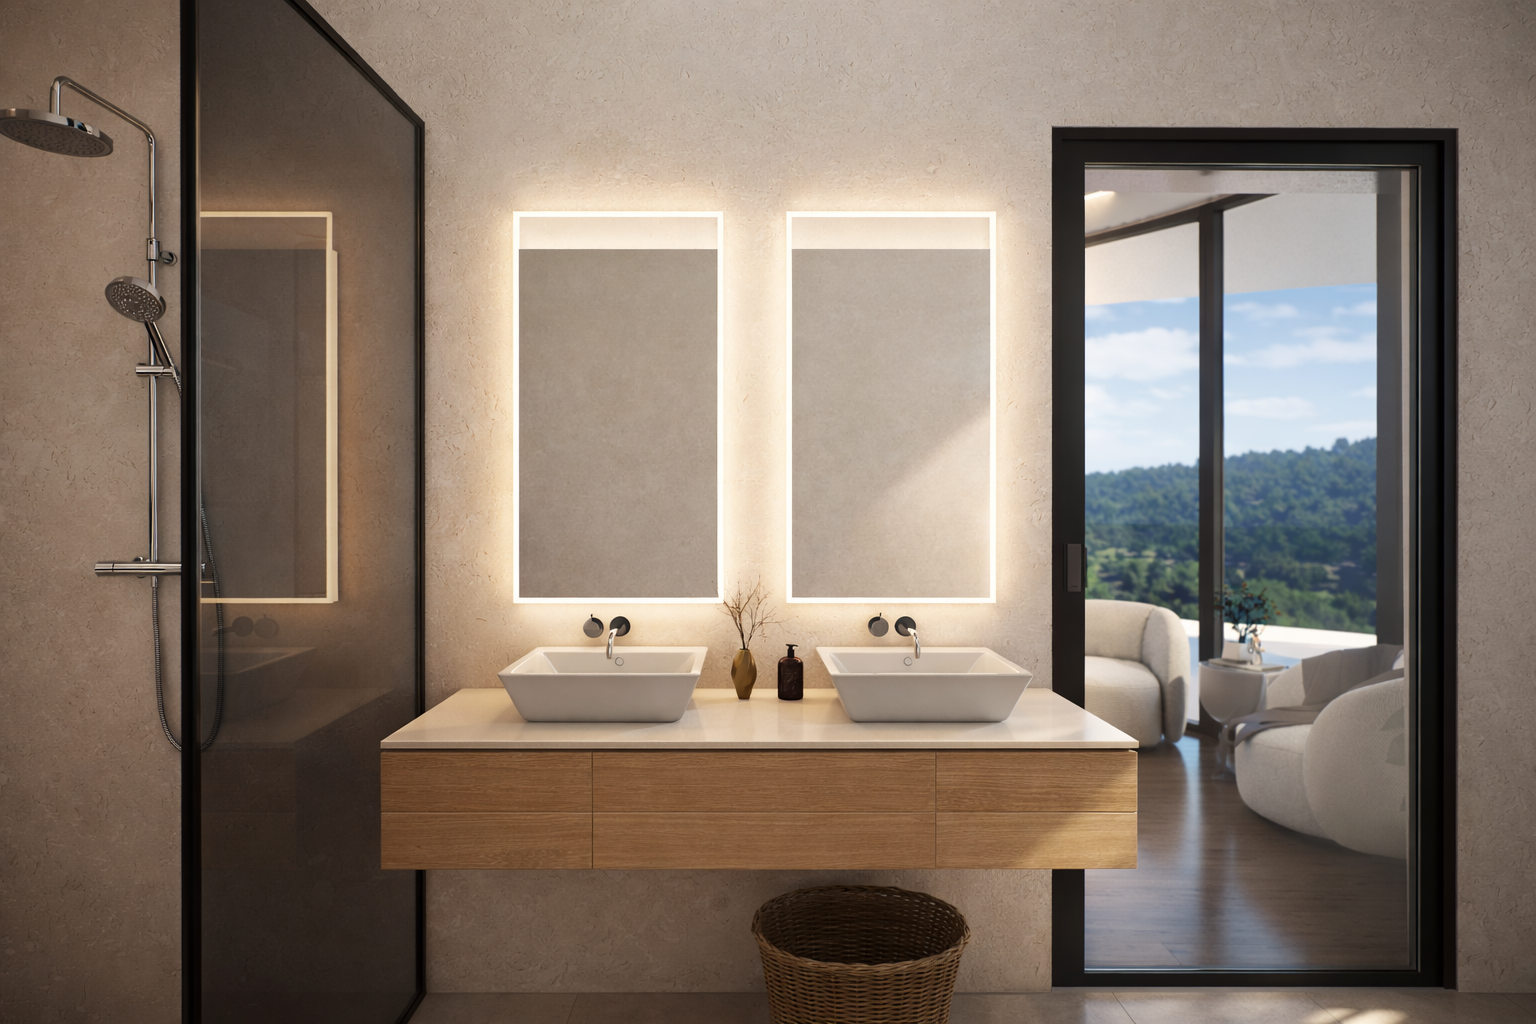
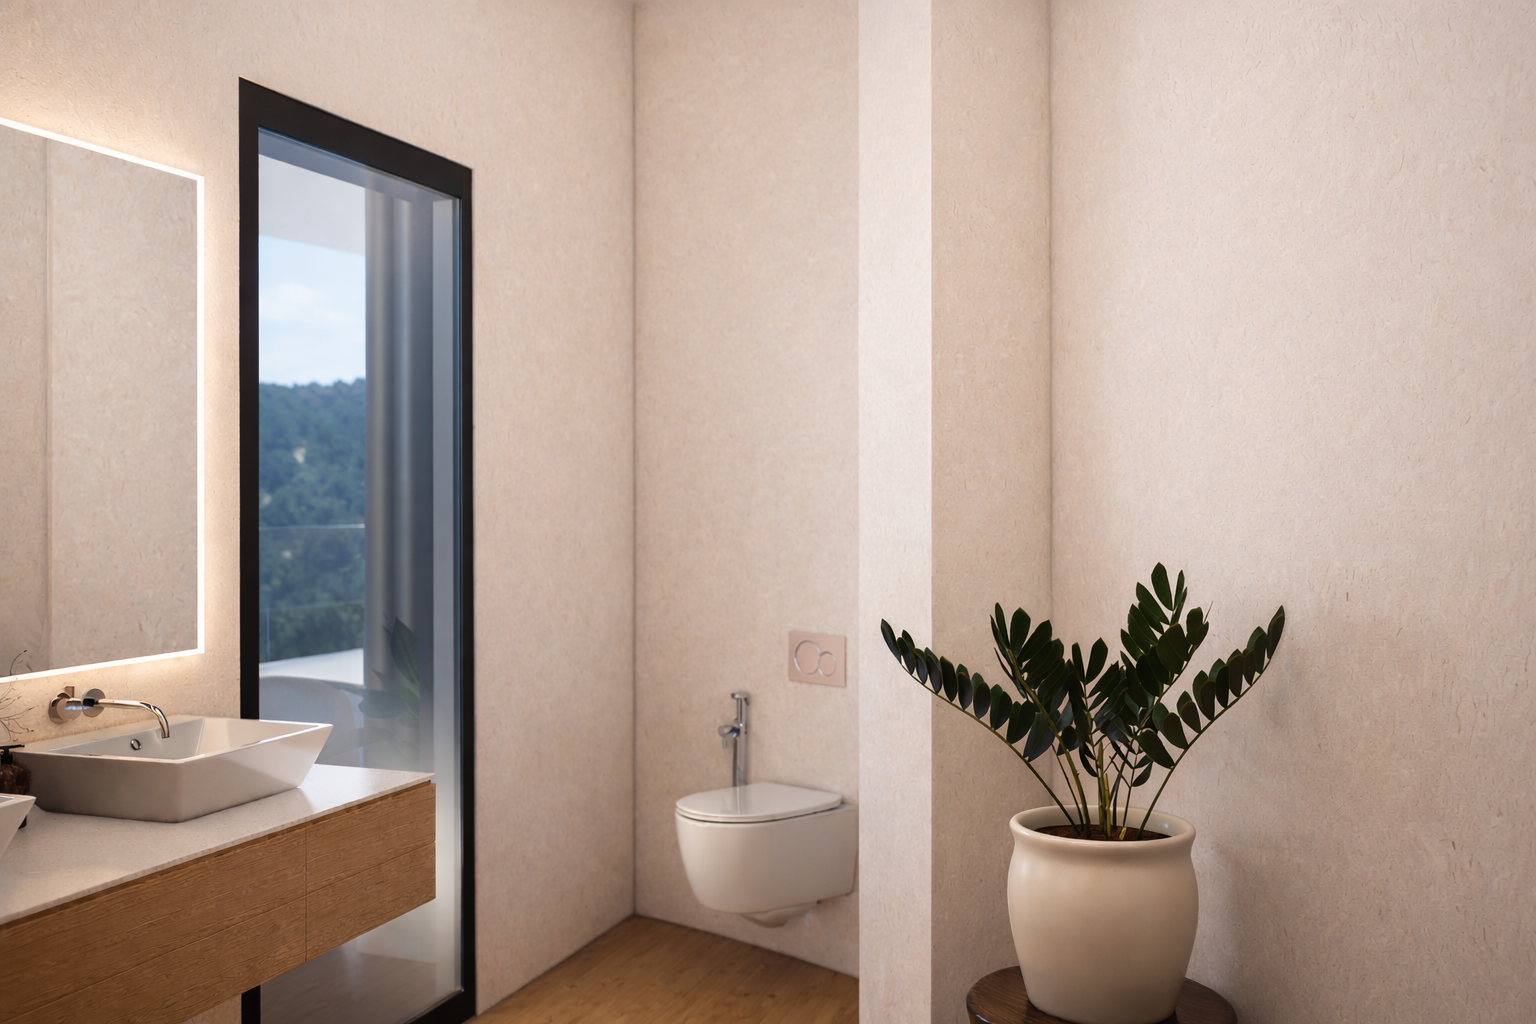
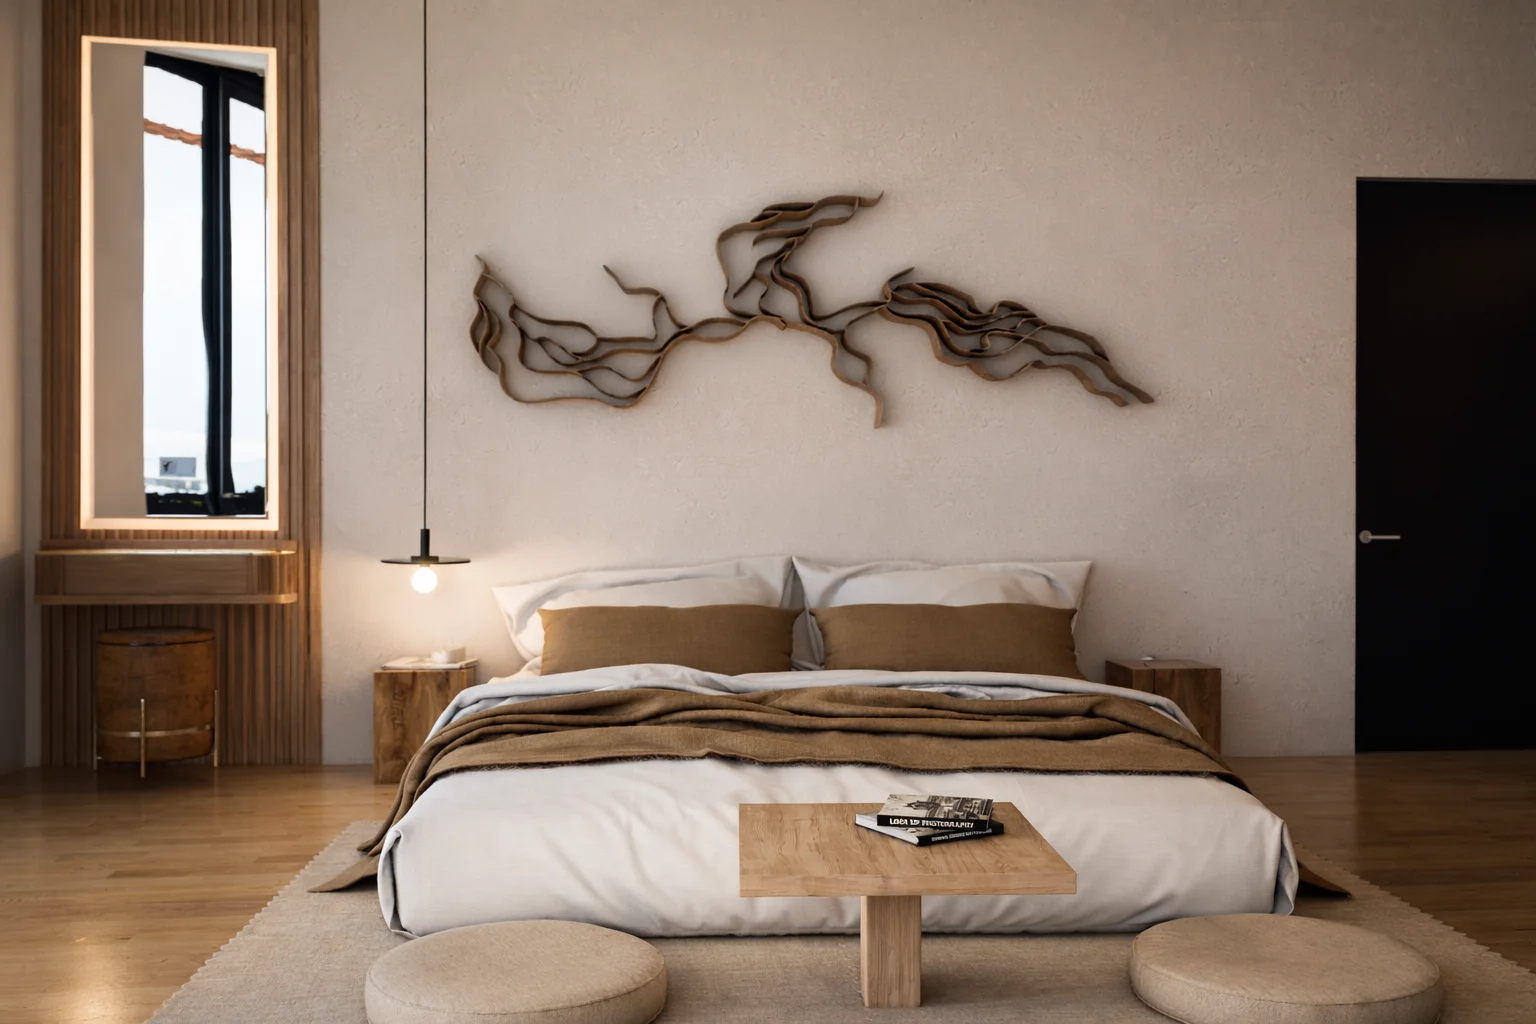
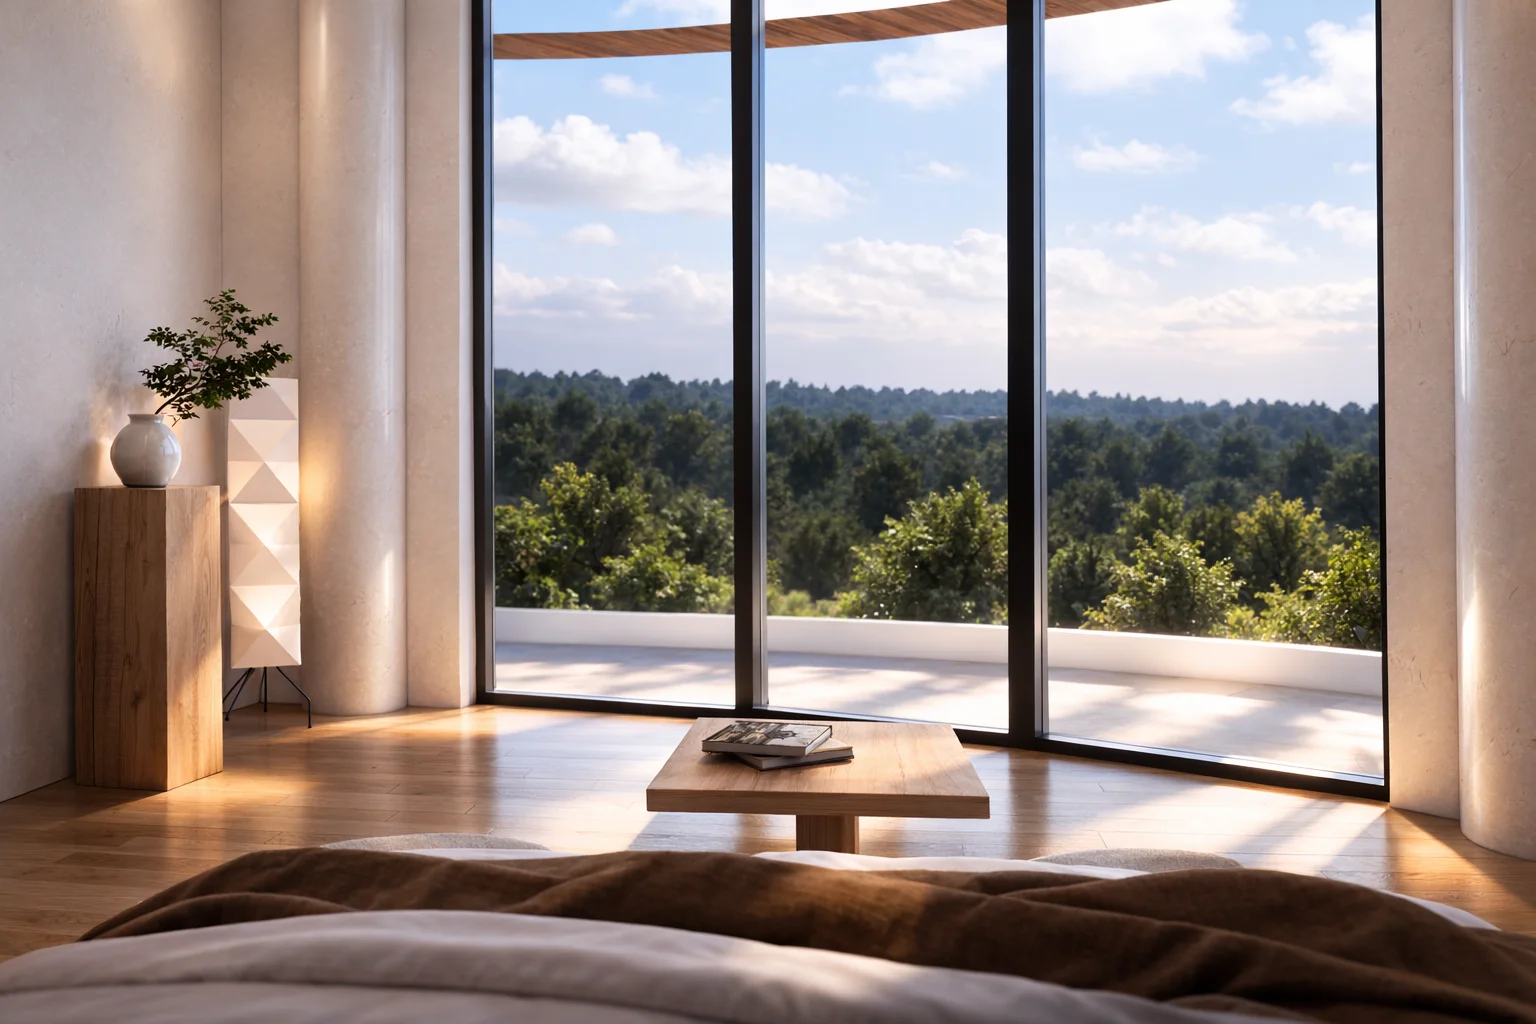
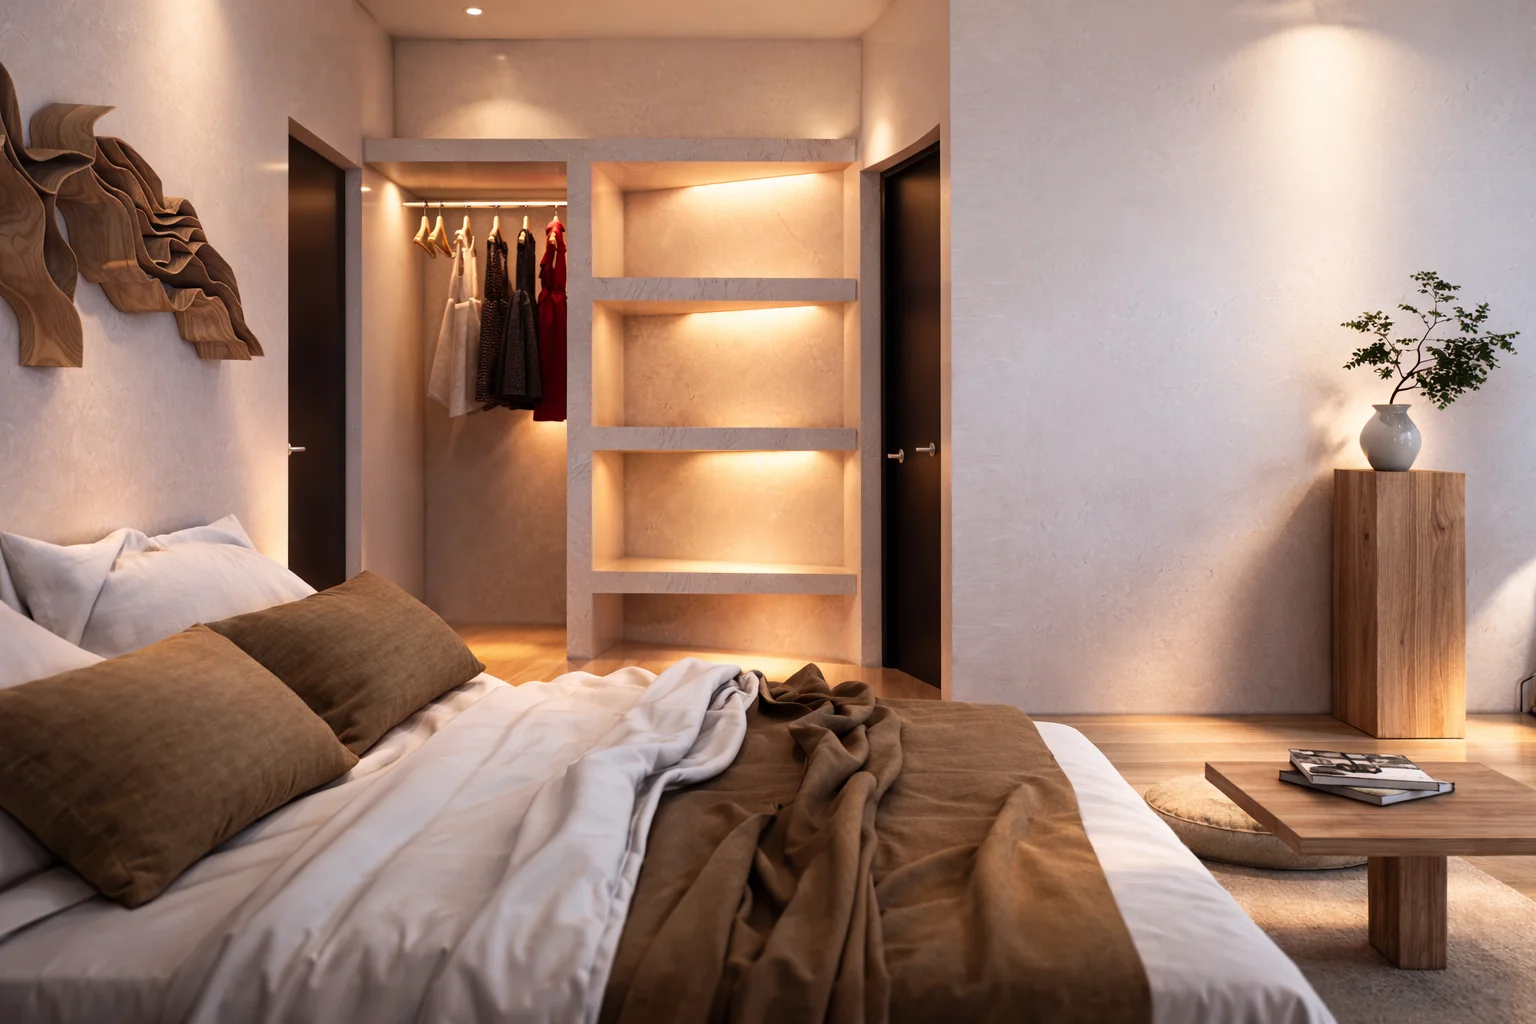
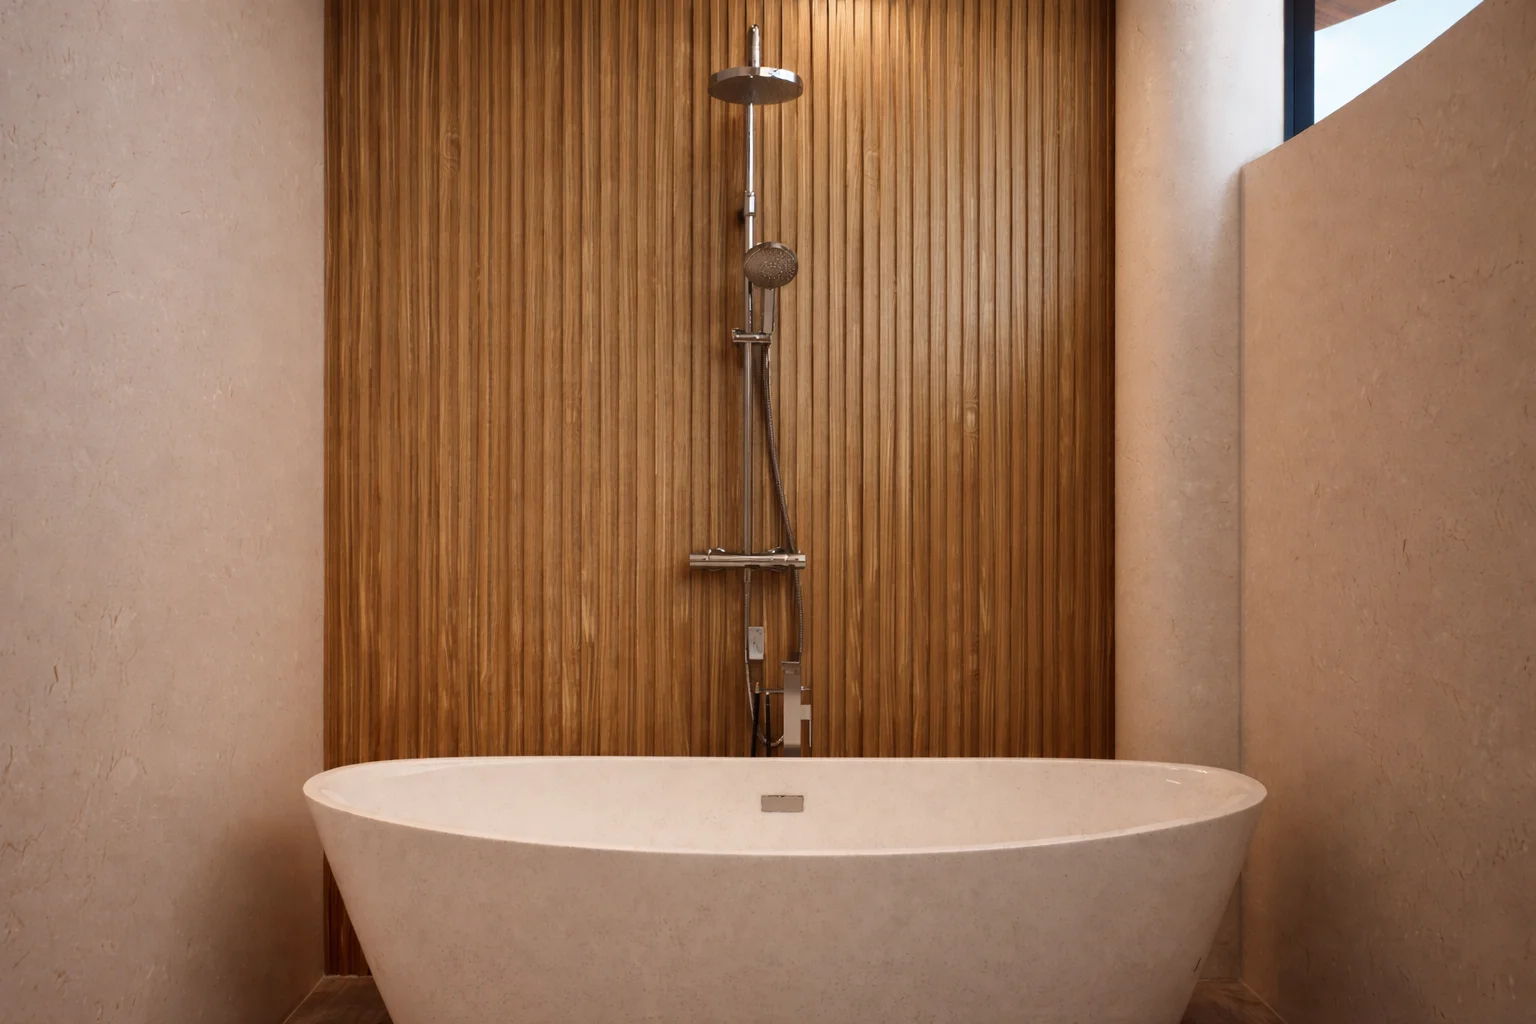
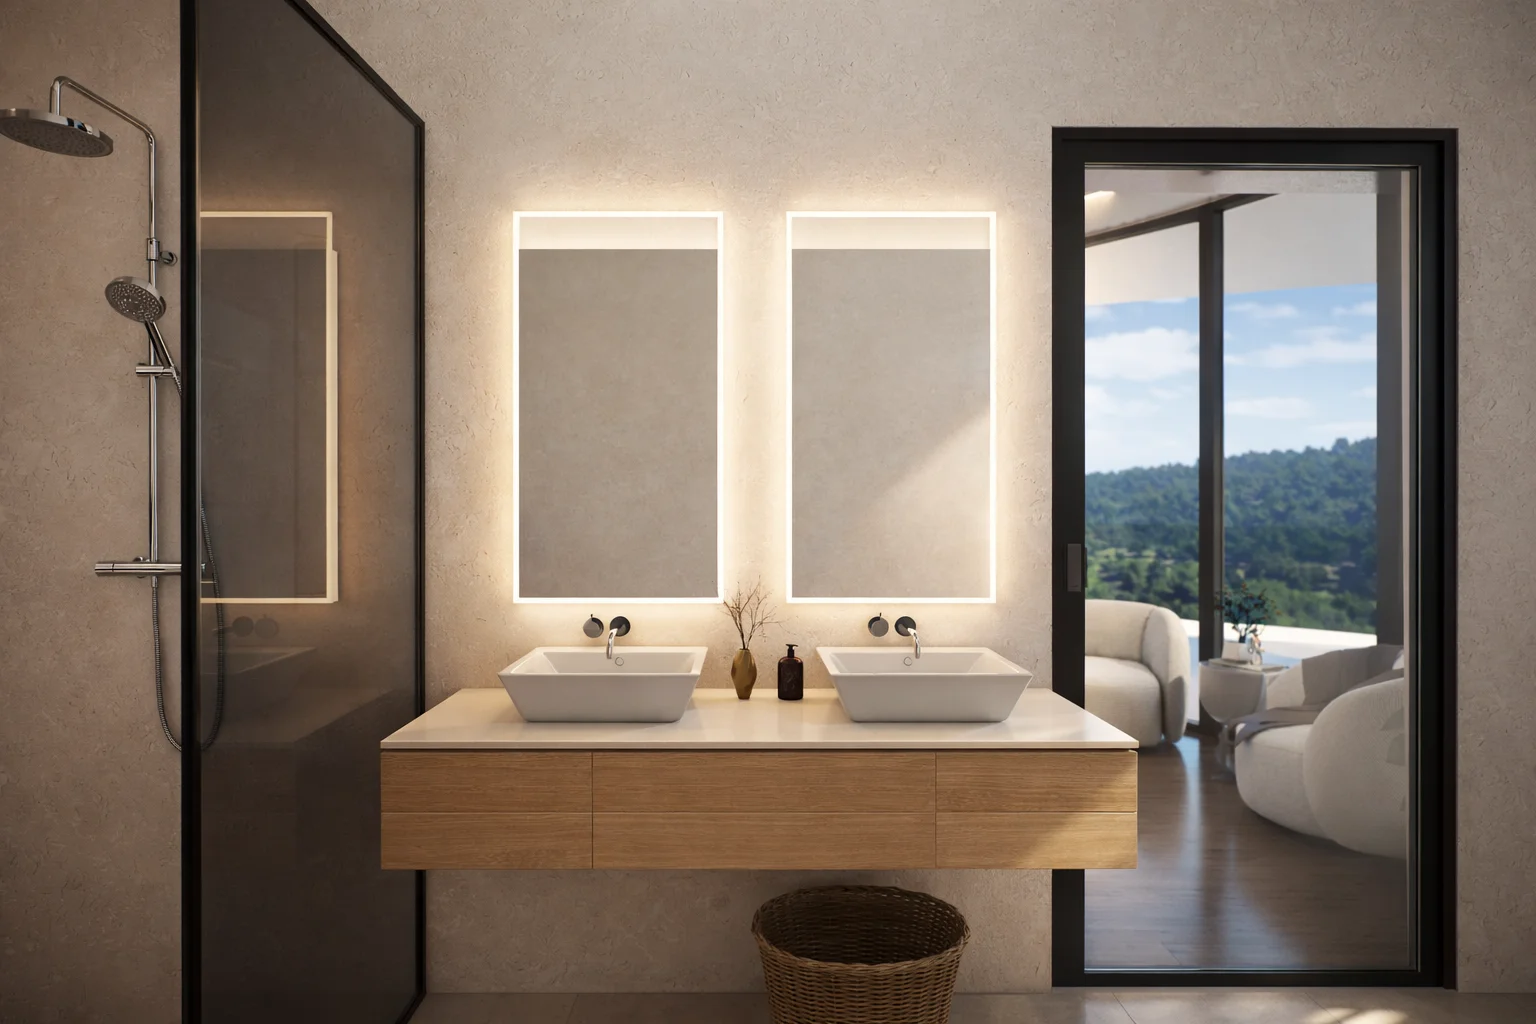
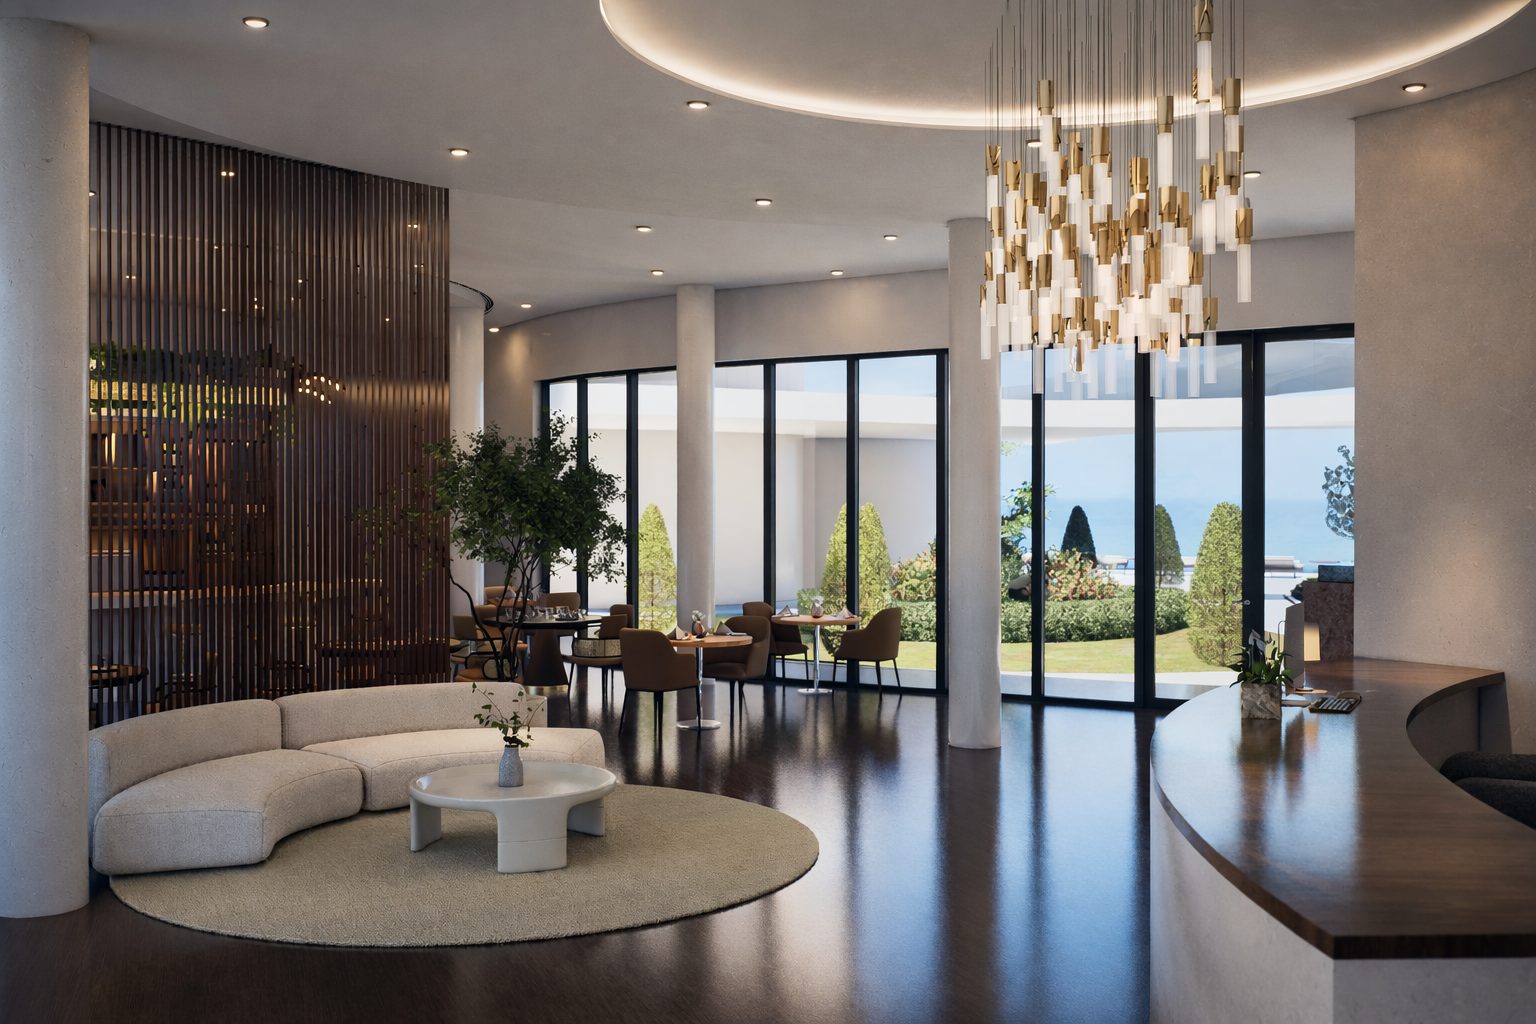
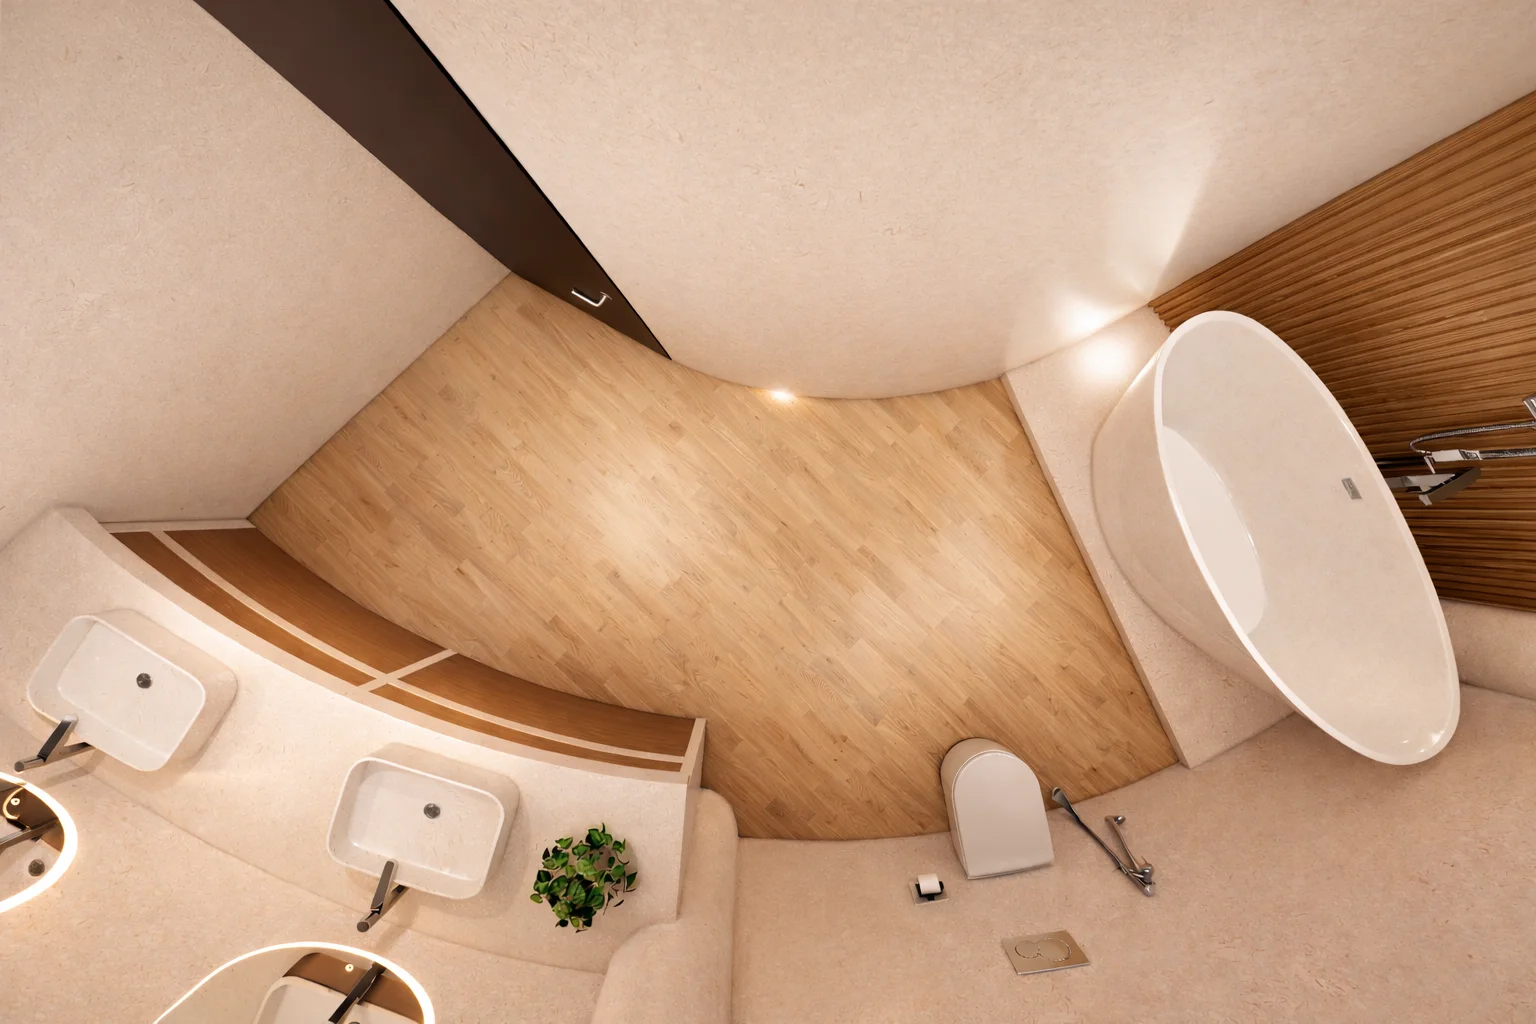
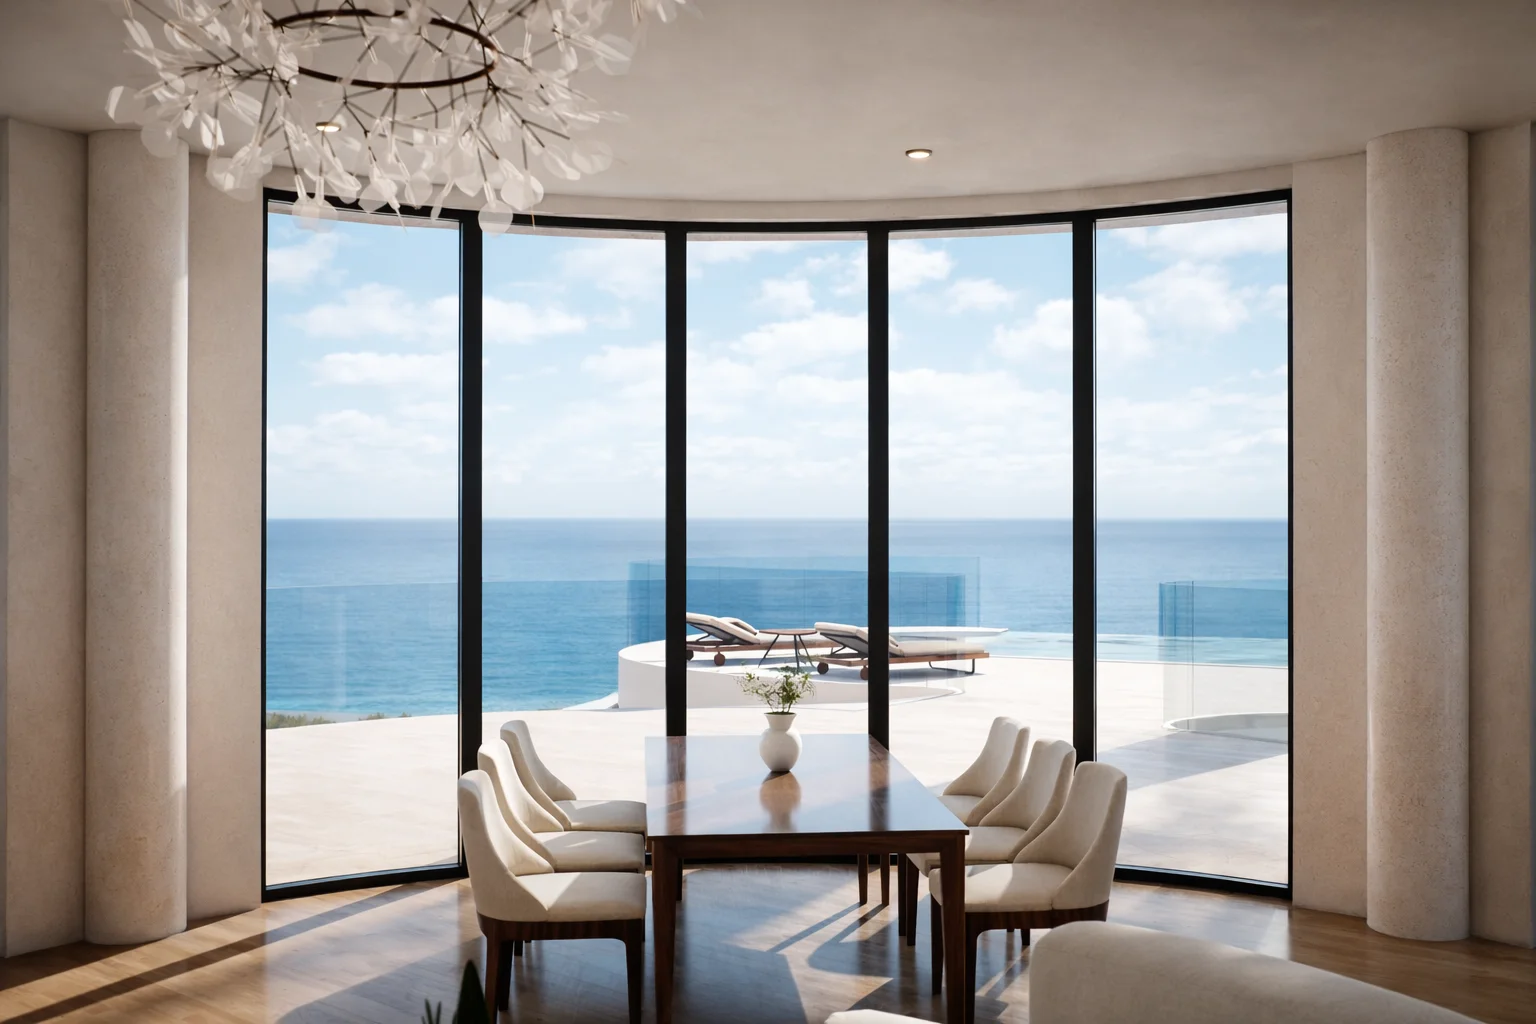
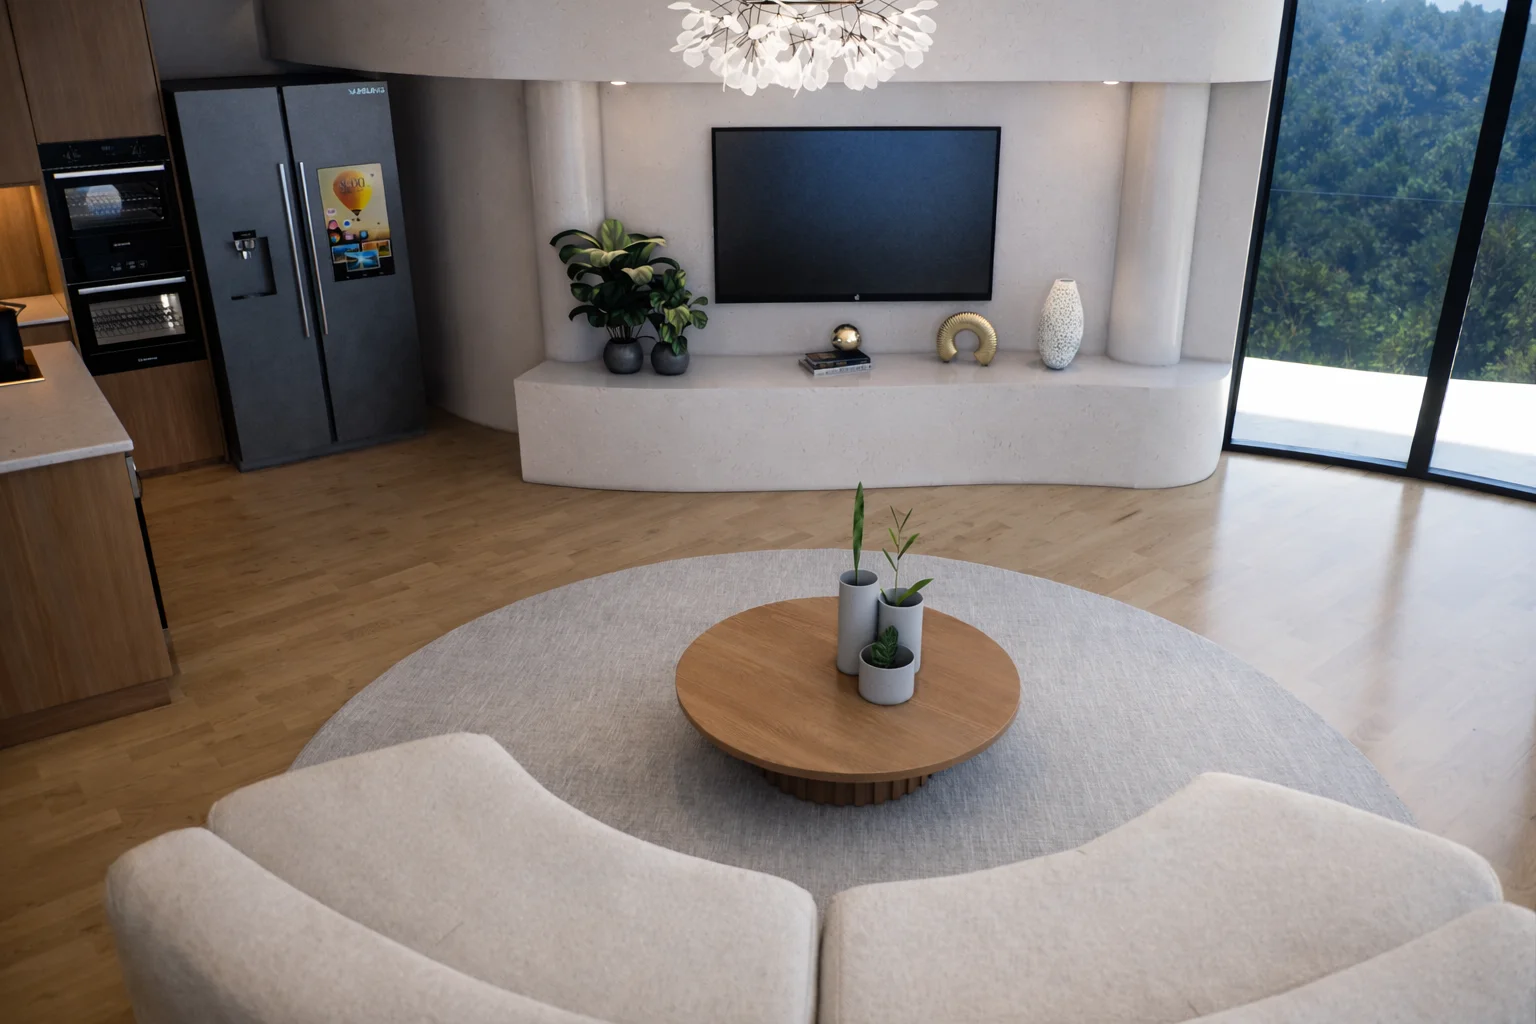
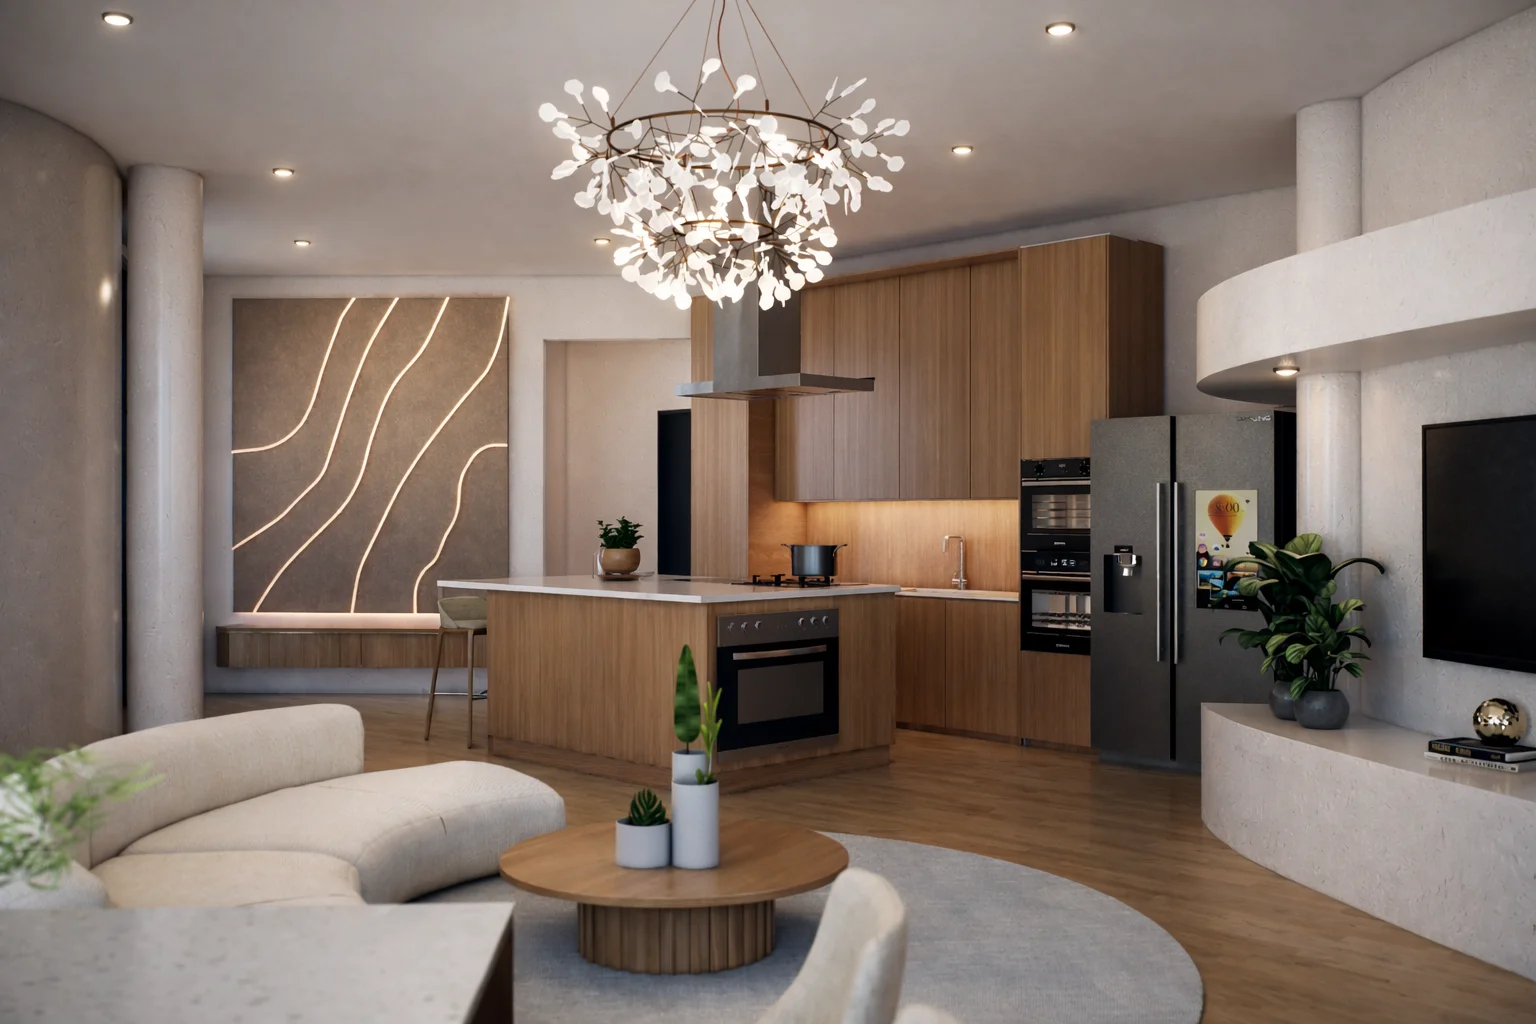
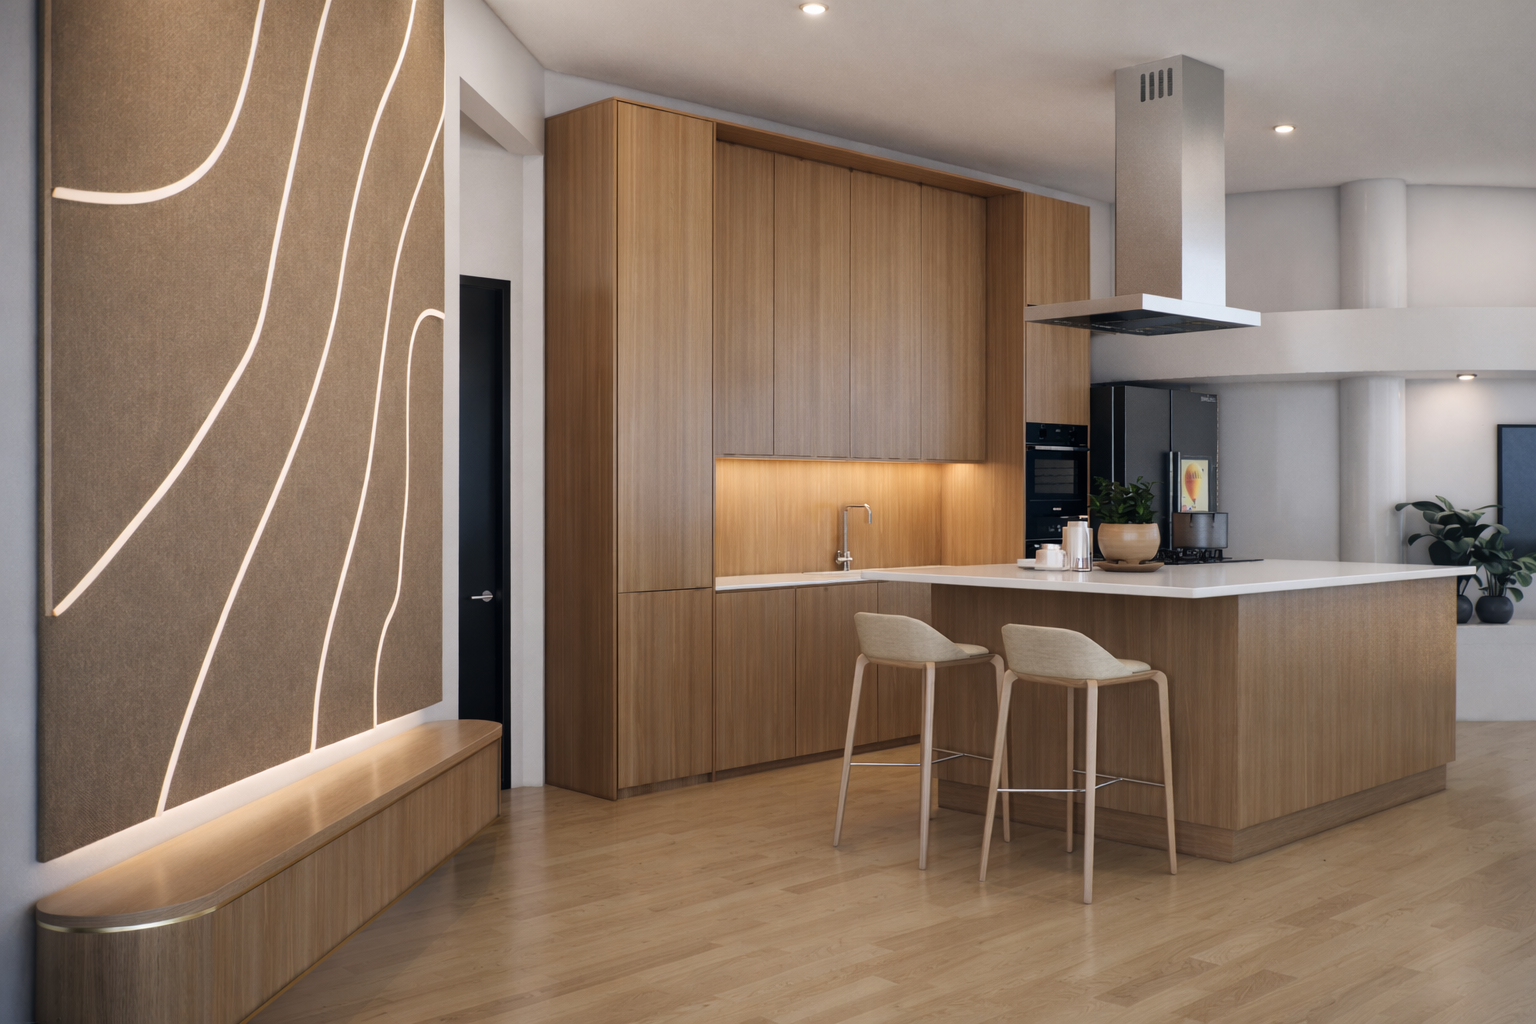
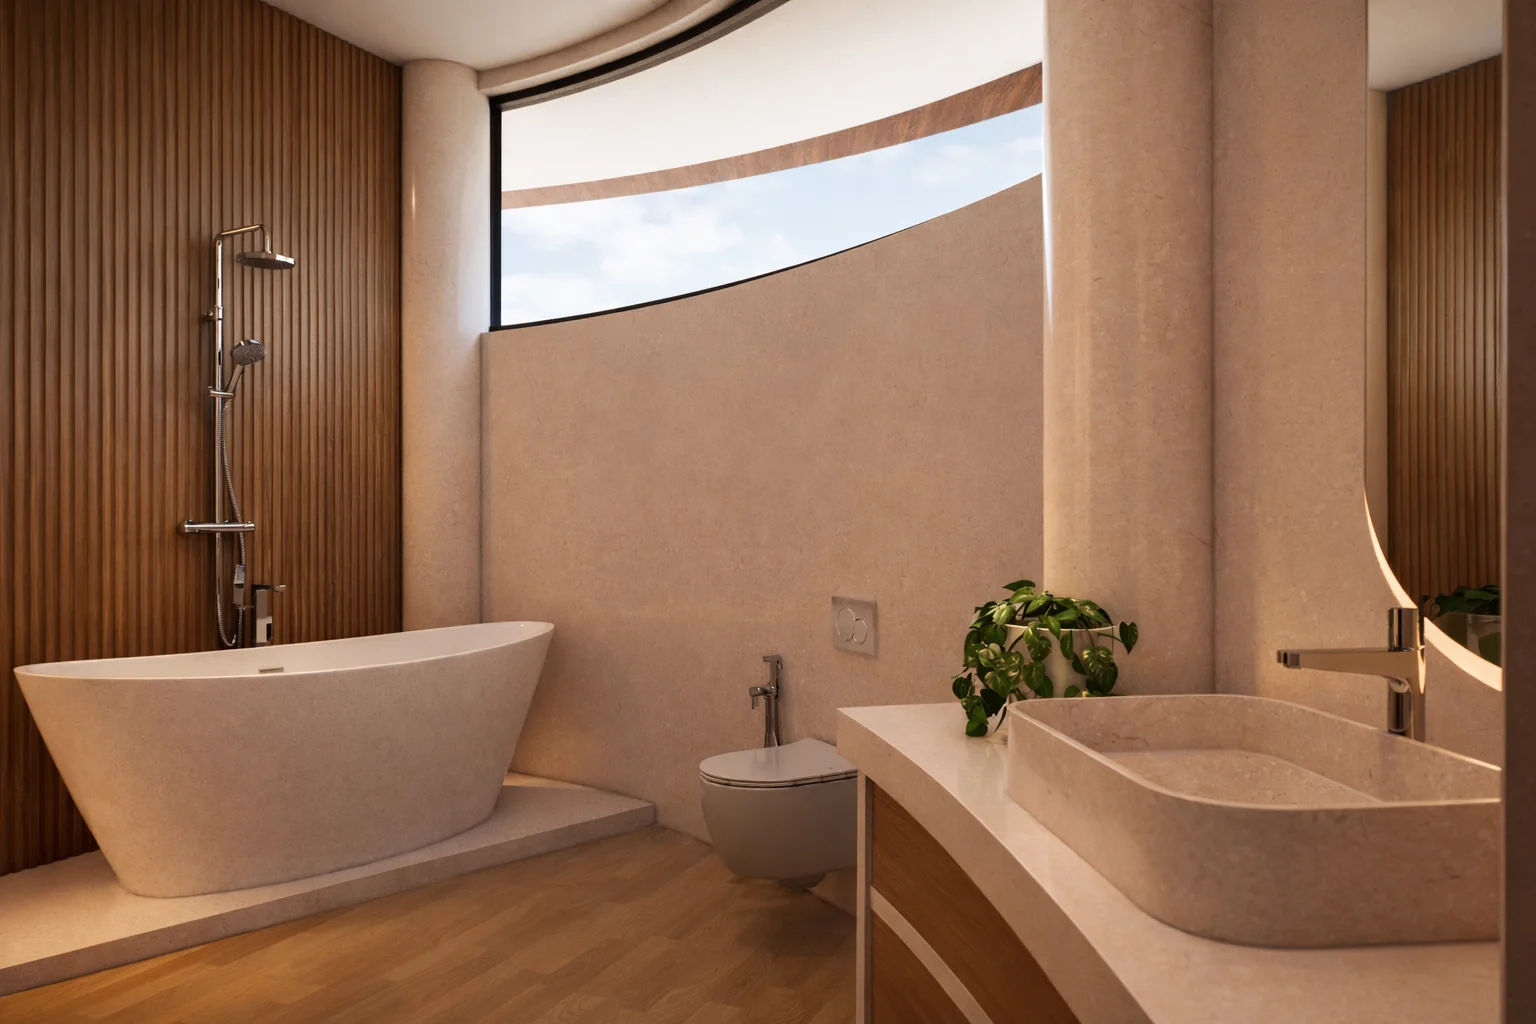
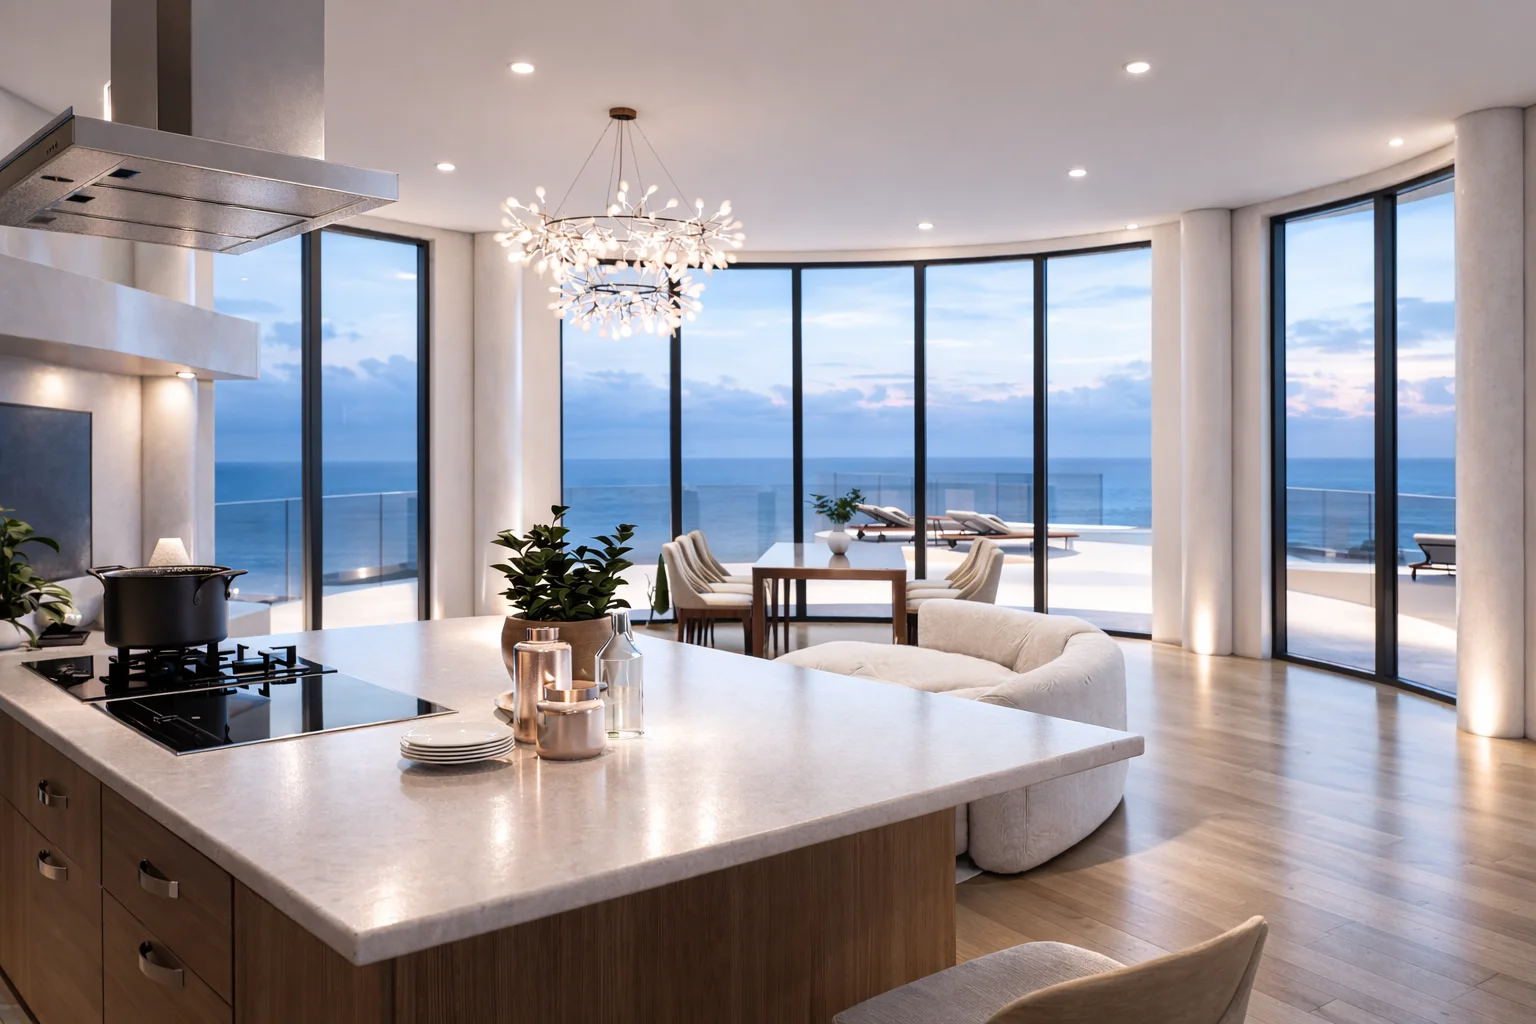
Nusa Penida Cliffside 프로젝트는 럭셔리 에코 투어리즘의 정수를 보여줍니다. 바다와 맞닿은 2,400㎡ 규모의 부지에 위치한 이 리조트는 지속 가능한 건축과 프리미엄 호스피탈리티 서비스를 결합하였습니다. 16개의 모든 객실은 프라이빗 풀과 비스포크 인테리어 디자인을 갖춘 독립된 안식처로 설계되었으며, 실내외 공간이 자연스럽게 연결되는 품격 있는 라이프스타일을 선사합니다.
전설적인 Nusa Penida 섬의 절벽 위에 자리한 엘리트 부티크 리조트입니다. 끝없이 펼쳐진 오션 뷰를 품은 8개동의 울트라 럭셔리 빌라를 선보입니다.
€3,680k
€50k
22.70%
Freehold
Discover the mix of premium villas and suites driving the resort revenue, with average daily rates (ADR) scaled by exclusivity.
Rather than a simple average, the resort average daily rate (ADR) of €411.25 is calculated dynamically using a weighted average based on inventory mix. This yields highly precise, risk-adjusted yield pro-formas.
In luxury boutique operations, rooms drive only a portion of total yield. Pro-formas integrate additional revenue streams calculated as ratios of room revenues:
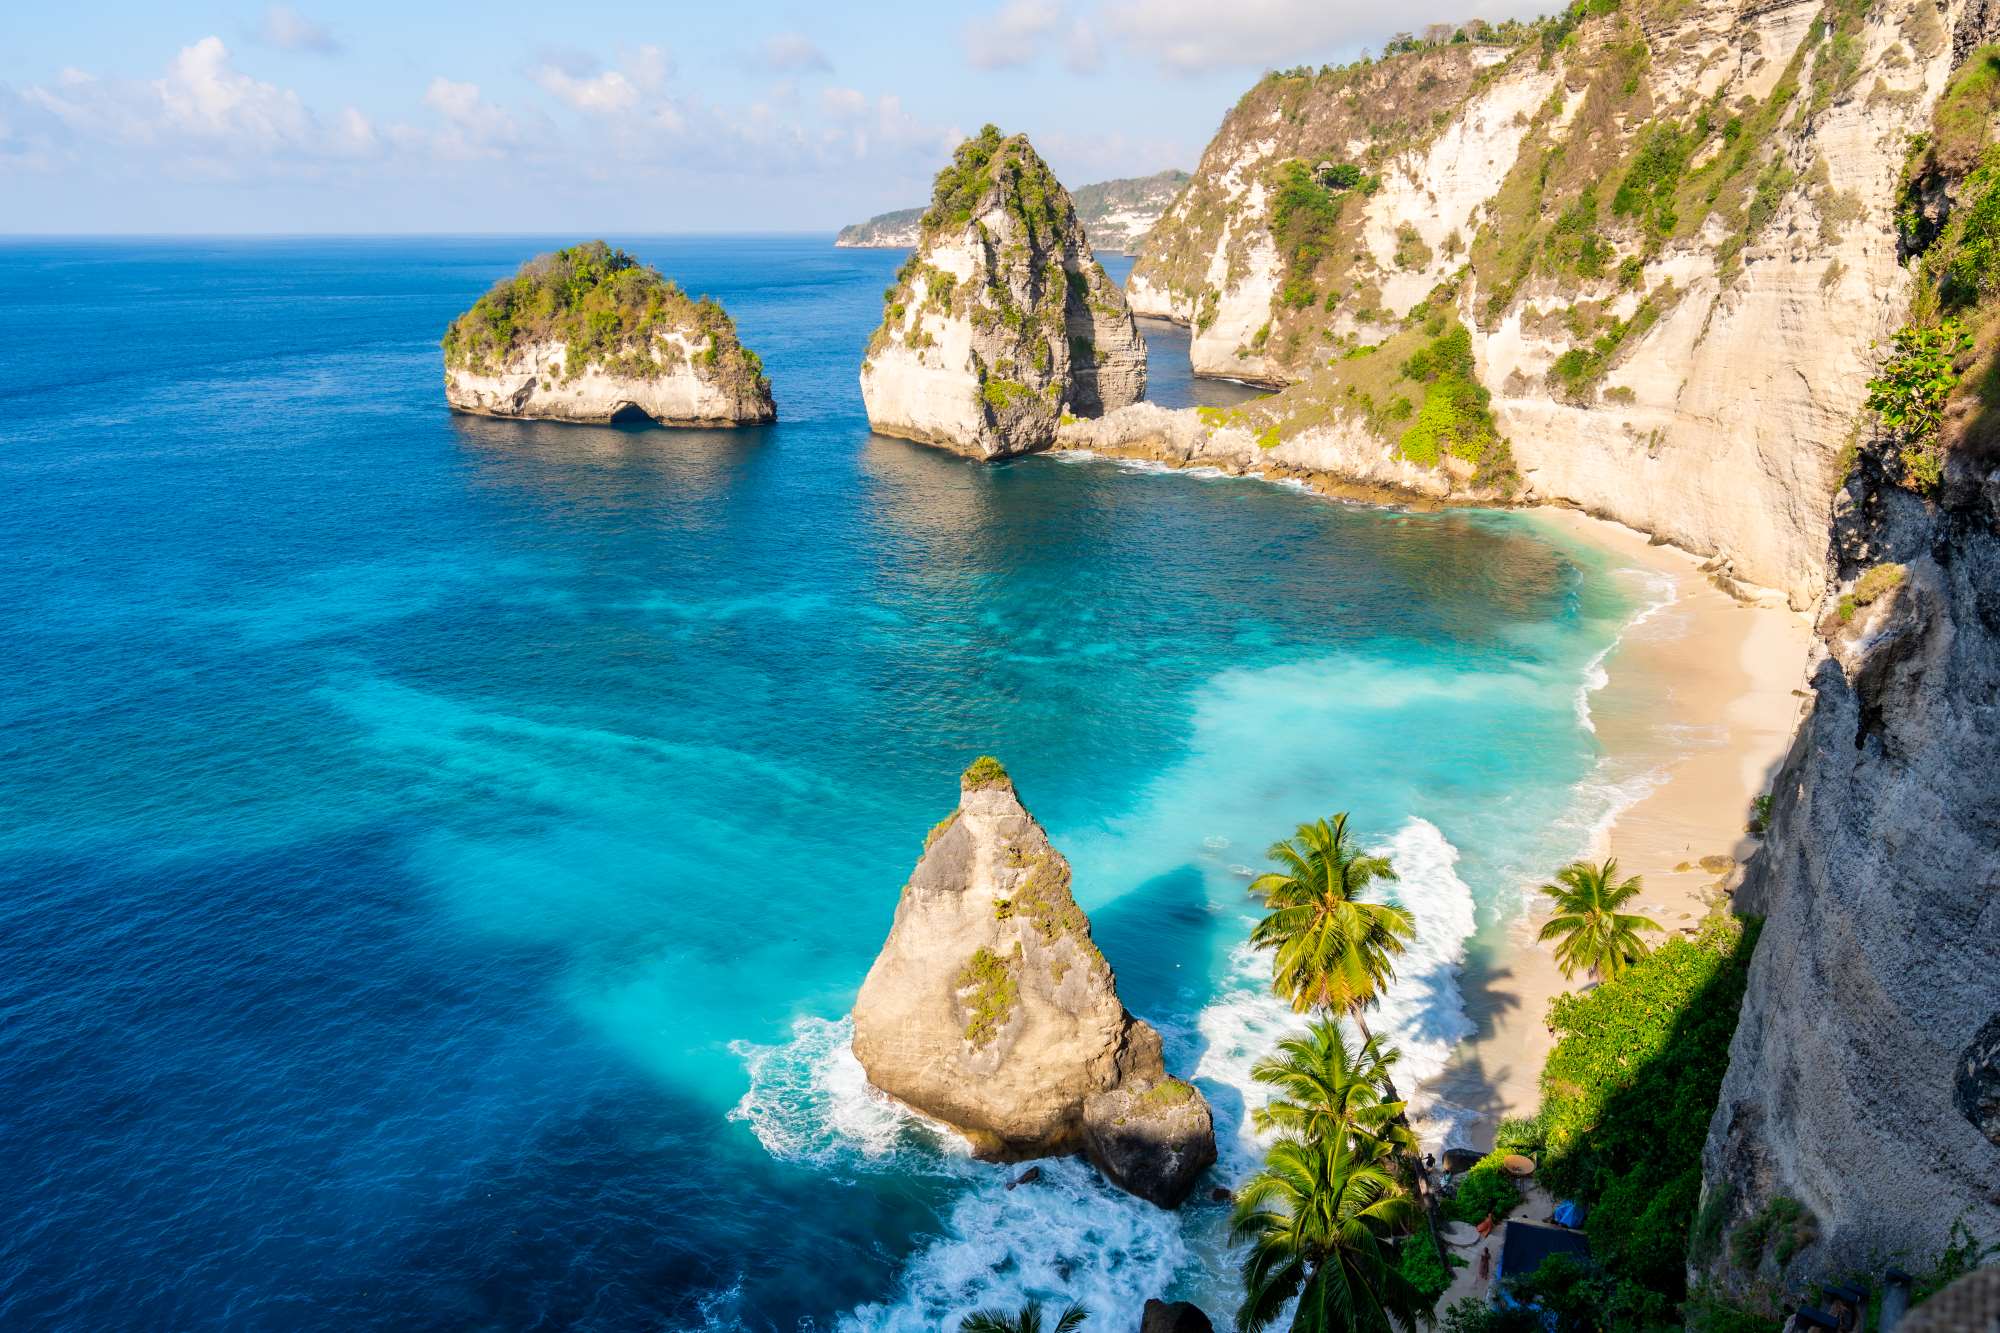
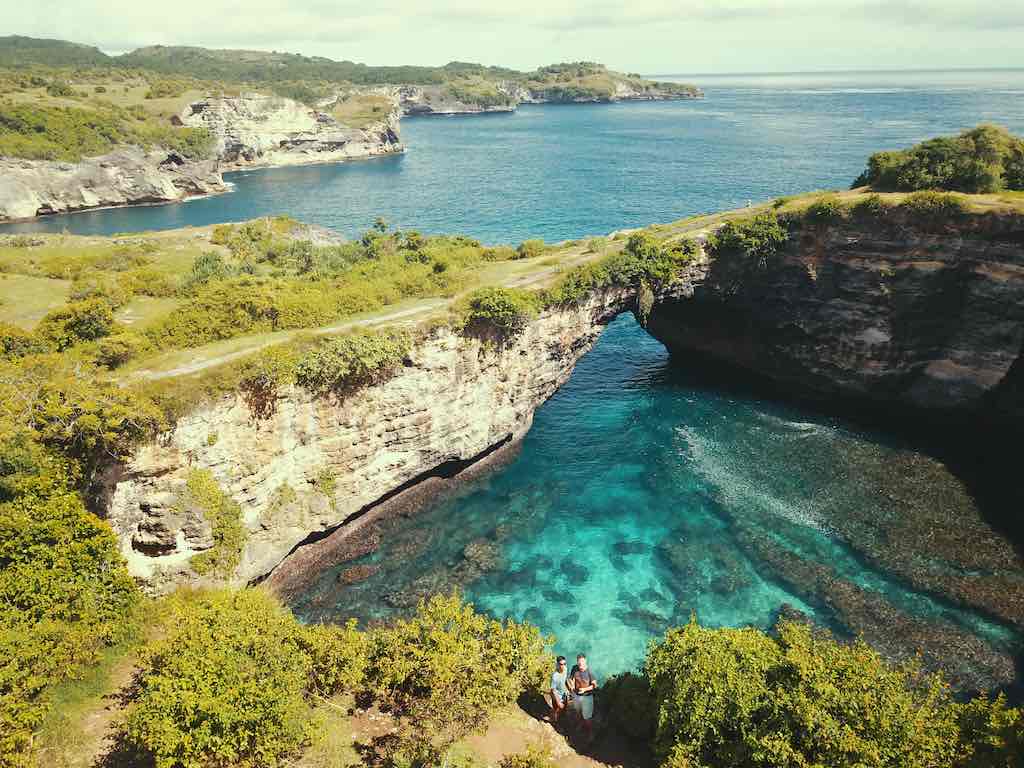
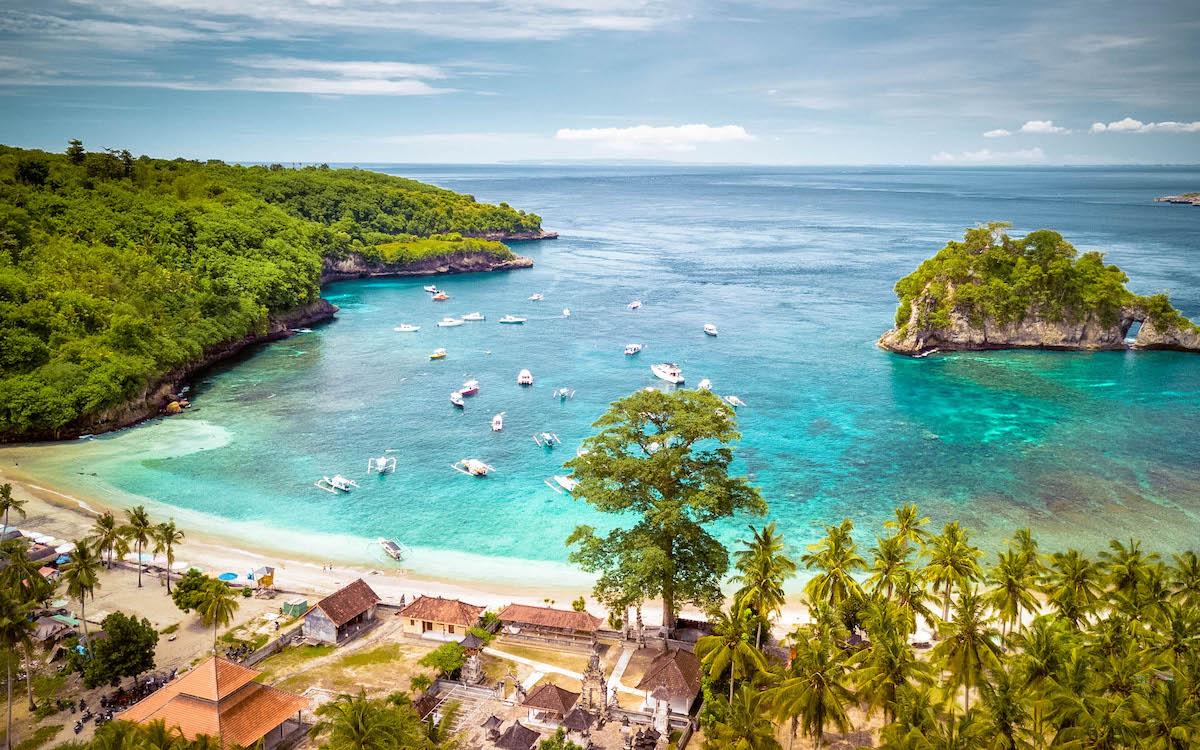
Nusa Penida: 발리 친환경 럭셔리 관광의 새로운 중심지로서, 프리미엄 여행 수요의 기록적인 성장을 맞이하고 있습니다.


| Metric | Value |
|---|---|
| Land Cost | €0 (est.) |
| Construction Cost | €0 (est.) |
| Development Cost | €0 (est.) |
| Projected Exit Value | €0 (est.) |
| ROI | 22.70% |
| Timeline | 18 Months |
실제 시장 데이터를 기반으로 한 전략적 분석: 당일치기 관광에서 고급 장기 체류로의 전환.
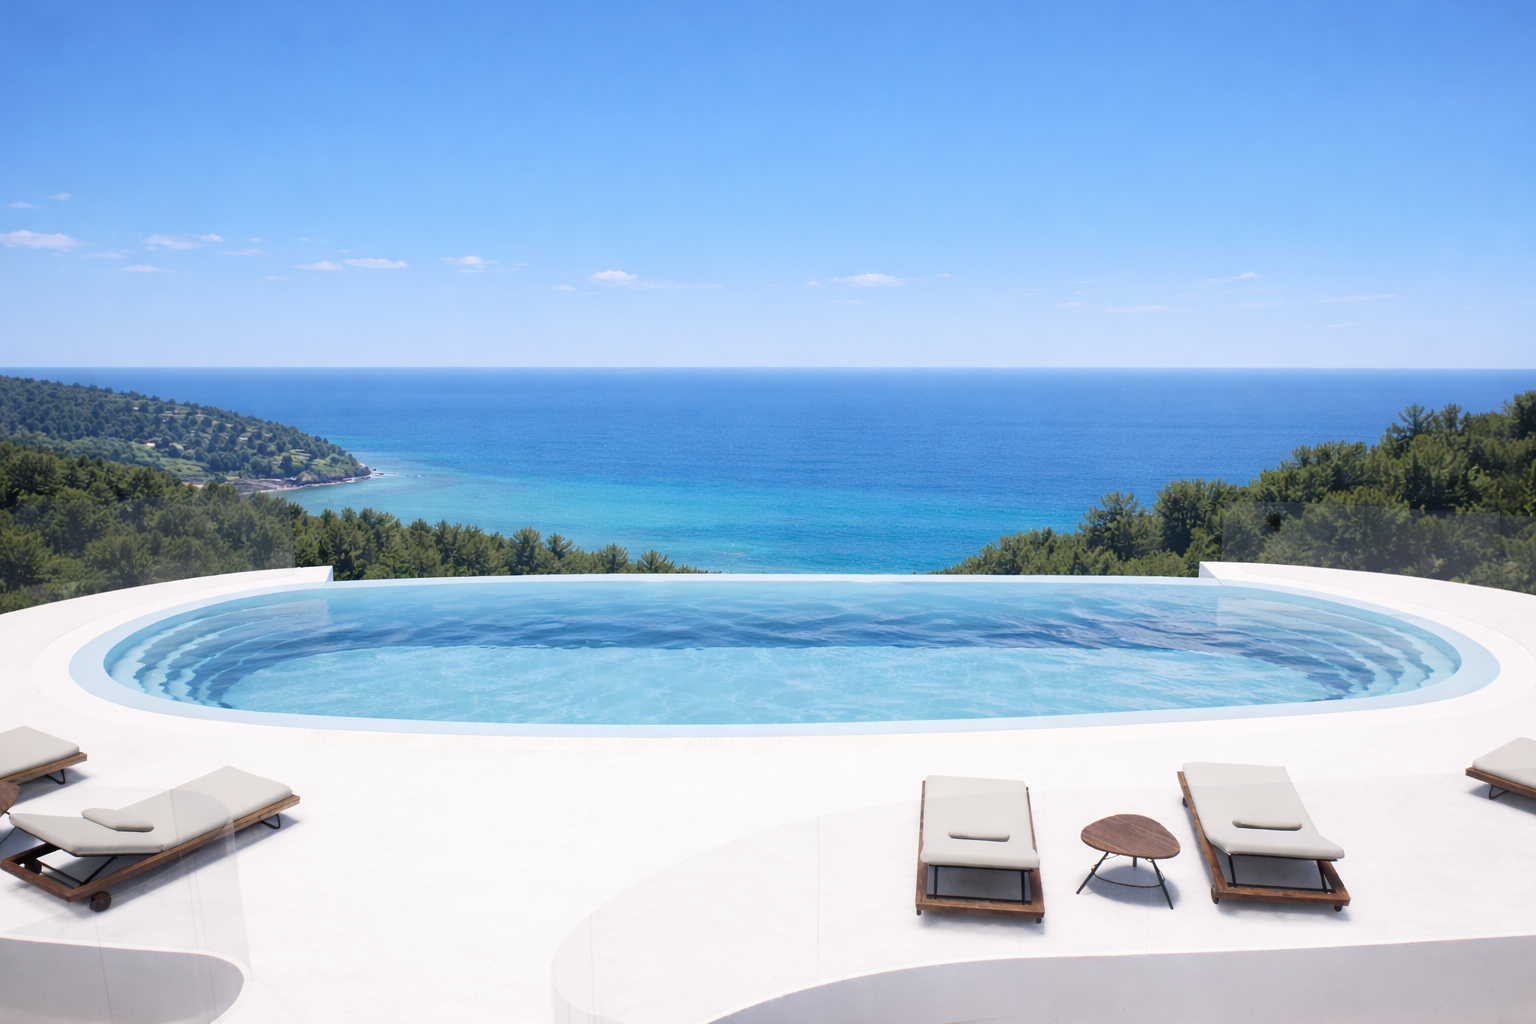
본 프로젝트는 Nusa Penida 환대 산업의 최상위 세그먼트에 위치하며, 프라이버시와 장엄한 전망을 보장하는 독보적인 절벽 위 입지를 활용합니다. "Domo" 건축 양식은 단순한 미학적 선택을 넘어, 시장 평균 이상의 ADR(객단가)을 확보하기 위한 전략적 결정입니다.
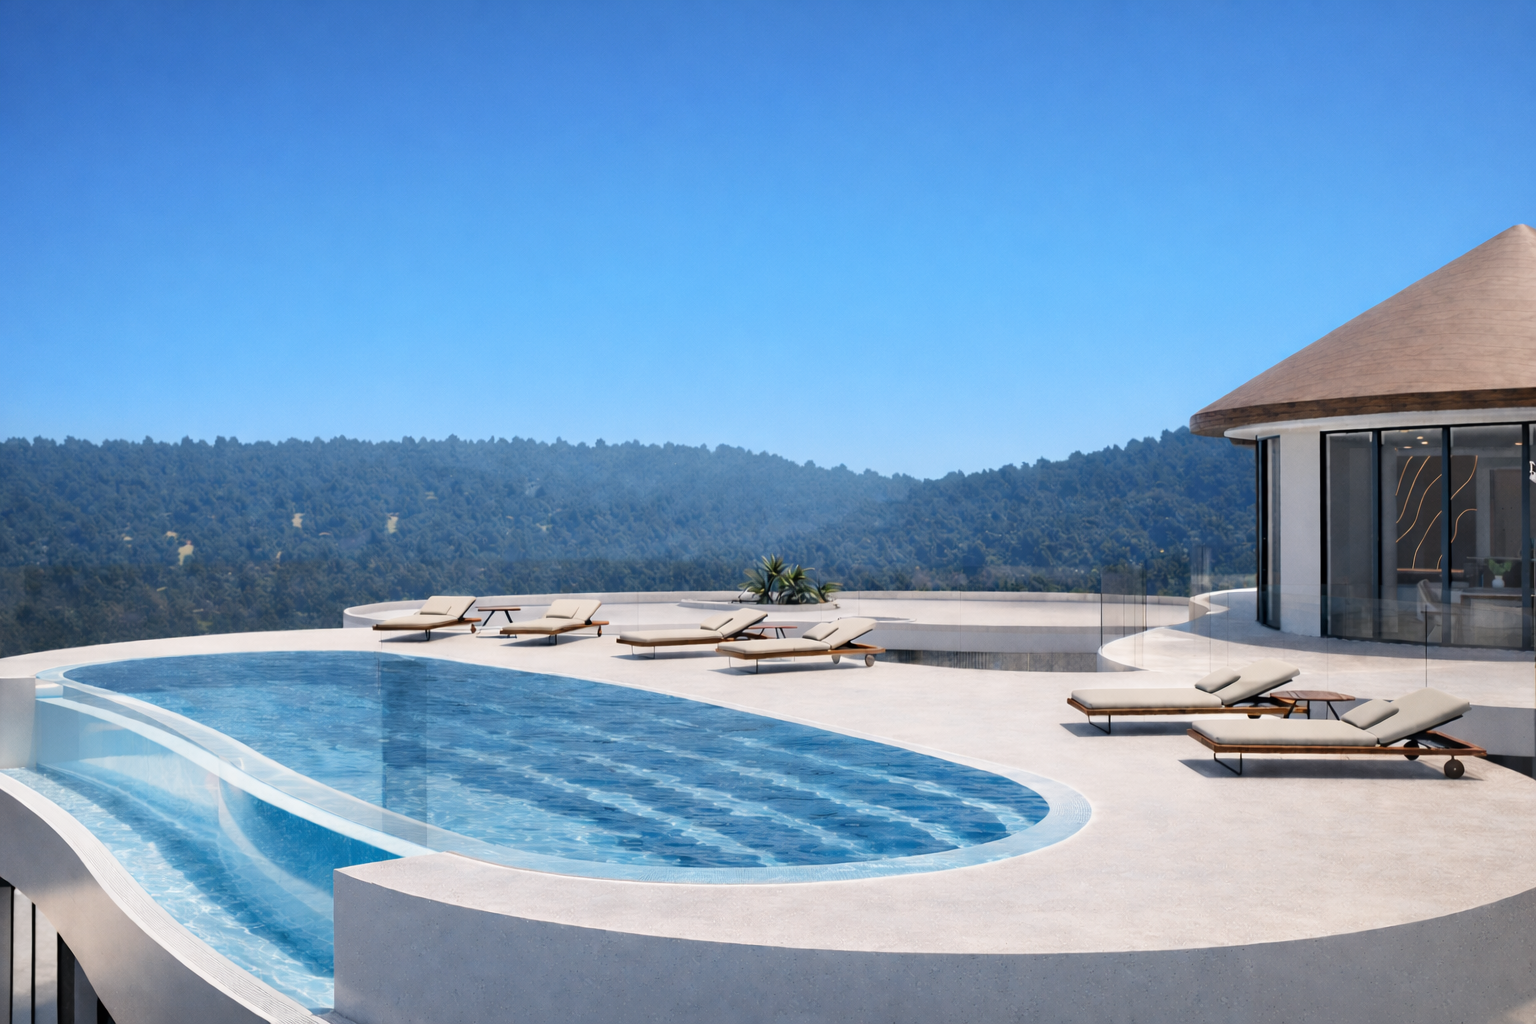
당사는 고정비를 절감하고 EBITDA 마진을 극대화하는 린(Lean) 경영 모델을 채택하고 있습니다. 리조트의 저밀도 설계는 대규모 호텔 단지의 과도한 고정비 부담 없이 최적의 직원 대 투숙객 비율을 유지하며 엘리트 서비스를 제공합니다.
Nusa Penida의 방문객 수는 2017년 20만 명에서 2024년 110만 명 이상으로 급증했습니다. 핵심적인 변화는 "단기 체류형" 여행자에서 "장기 럭셔리 숙박"으로의 전환입니다. 기관 투자자들과 성장하는 "슬로우 트래블(slow-travel)" 세그먼트는 독점적인 저밀도 공간을 추구하고 있습니다. 당사는 절벽 위 프라임 로케이션에 자리 잡음으로써 섬의 럭셔리 붐 초기 성숙 단계를 선점하고 있으며, Canggu와 같은 포화 시장보다 높은 자본 가치 상승을 기대하고 있습니다.
Simulate your returns by adjusting the investment amount below.
27.1%
€1.9M
44.0%
5 Years
Year 7
€4.0M
€27.100
Based on IRR 27.1%The project is designed as a low-density, high-margin boutique resort, optimizing both pricing and operational efficiency. Revenue is driven by premium positioning, ocean-view units, and strong demand for experiential hospitality in Nusa Penida.
Operating costs are controlled through a lean operational model and selective outsourcing of non-core services, ensuring maximum conversion to EBITDA.
>Nusa Penida is one of Bali’s fastest-growing destinations, with increasing demand for high-end, design-driven accommodations.
Nusa Penida Cliffside의 예상 ADR(가중 평균) 550유로는 절벽 입지의 독보적인 가치와 Antonio Rutilio Architecture & Design의 상징적인 3층 디자인을 통해 그 타당성을 입증합니다. 본 리조트는 단 16개 유닛의 프라이빗 풀 빌라가 선사하는 희소성을 바탕으로 지역 시장 평균(ADR 350유로)을 상회하는 최상위 포지셔닝을 점유하고 있습니다. 이는 글로벌 고액 자산가 고객층을 유입시키는 핵심 동력이며, 연간 75%의 안정적인 객실 점유율을 뒷받침합니다.
The project targets a stabilized EBITDA margin of approximately 40–45%, generating consistent annual cash flow. Investors benefit from:
The project adopts a conservative financial approach with realistic occupancy and pricing assumptions.
Reducing operational complexity and staff overhead.
Architectural identity supporting premium ADR.
Accommodation, F&B, and Wellness revenue streams.
Direct sponsor involvement in development & control.
Disclaimer: This material is for informational purposes only and does not constitute an offer or solicitation to invest. Details are provided upon request for qualified partners.
This chart represents the strategic distribution of the €3.680.000 total investment. Architecture, land rights, and construction phases are prioritized to ensure asset longevity and premium positioning.
| Category | Investment Item | Amount |
|---|---|---|
| Land Acquisition | Freehold Acquisition | €720.000 |
| Construction | Main Structure & Roof | €1.500.000 |
| Furniture & Interiors | Elite FF&E Package | €450.000 |
| Other | Safety Reserve | €290.000 |
| Design & Architecture | Architectural & Technical Design | €300.000 |
| Furniture & Interiors | Lighting & decoration | €80.000 |
| Furniture & Interiors | Equipment (AC, system) | €120.000 |
| Project Management | Project management | €70.000 |
| Design & Architecture | Engineering consultant | €50.000 |
| Permits & Legal | Building permits & licenses | €60.000 |
| Permits & Legal | Legal & company setup | €15.000 |
| Other | Staff training & hiring | €25.000 |
| ESTIMATED TOTAL CAPITAL | €3.680.000 | |
These figures represent institutional benchmarks for the location and asset class. Scenario Mode shifts these variables to simulate risk.
Total gross income generated over the project lifecycle.
Net capital remaining after all costs and investment recovery.
Performance operative excluding non-cash items and taxes.
Net profit share attributable to your specific investment.
Full capital recovery achieved before stabilization phase. This model illustrates a balanced risk-return profile, with strong cash flow generation and clear capital recovery timeline.
| Year | Estimated Occupancy | Gross Revenue | Operational Profit (EBITDA) | Net Cash Flow |
|---|---|---|---|---|
| Year 1 | 55% | €1.212.028 | €387.849 | €318.036 |
| Year 2 | 65% | €1.475.369 | €531.133 | €435.529 |
| Year 3 | 75% | €1.751.932 | €700.773 | €574.634 |
| Year 4 | 77% | €1.849.555 | €776.813 | €636.987 |
| Year 5 | 75% | €1.851.097 | €814.483 | €667.876 |
| Year 6 | 75% | €1.900.680 | €836.299 | €685.766 |
| Year 7 | 75% | €1.950.263 | €858.116 | €703.655 |
| Year 8 | 75% | €1.999.846 | €879.932 | €721.545 |
| Year 9 | 75% | €2.049.429 | €901.749 | €739.434 |
| Year 10 | 75% | €2.099.012 | €923.565 | €757.324 |
| Year 11 | 75% | €2.161.983 | €951.272 | €780.043 |
| Year 12 | 75% | €2.226.842 | €979.811 | €803.445 |
| Year 13 | 75% | €2.293.647 | €1.009.205 | €827.548 |
| Year 14 | 75% | €2.362.457 | €1.039.481 | €852.374 |
| Year 15 | 75% | €2.433.331 | €1.070.665 | €877.946 |
| Year 16 | 75% | €2.506.331 | €1.102.785 | €904.284 |
| Year 17 | 75% | €2.581.520 | €1.135.869 | €931.413 |
| Year 18 | 75% | €2.658.966 | €1.169.945 | €959.355 |
| Year 19 | 75% | €2.738.735 | €1.205.043 | €988.136 |
| Year 20 | 75% | €2.820.897 | €1.241.195 | €1.017.780 |
| Year 21 | 75% | €2.905.524 | €1.278.431 | €1.048.313 |
| Year 22 | 75% | €2.992.690 | €1.316.783 | €1.079.762 |
| Year 23 | 75% | €3.082.470 | €1.356.287 | €1.112.155 |
| Year 24 | 75% | €3.174.945 | €1.396.976 | €1.145.520 |
| Year 25 | 75% | €3.270.193 | €1.438.885 | €1.179.886 |
| Year 26 | 75% | €3.368.299 | €1.482.051 | €1.215.282 |
| Year 27 | 75% | €3.469.348 | €1.526.513 | €1.251.741 |
| Year 28 | 75% | €3.573.428 | €1.572.308 | €1.289.293 |
| Year 29 | 75% | €3.680.631 | €1.619.478 | €1.327.972 |
| Year 30 | 75% | €3.791.050 | €1.668.062 | €1.367.811 |
| Year 31 | 75% | €3.904.781 | €1.718.104 | €1.408.845 |
| Year 32 | 75% | €4.021.925 | €1.769.647 | €1.451.110 |
| Year 33 | 75% | €4.142.582 | €1.822.736 | €1.494.644 |
| Year 34 | 75% | €4.266.860 | €1.877.418 | €1.539.483 |
| Year 35 | 75% | €4.394.866 | €1.933.741 | €1.585.668 |
| Year 36 | 75% | €4.526.712 | €1.991.753 | €1.633.238 |
| Year 37 | 75% | €4.662.513 | €2.051.506 | €1.682.235 |
| Year 38 | 75% | €4.802.388 | €2.113.051 | €1.732.702 |
| Year 39 | 75% | €4.946.460 | €2.176.442 | €1.784.683 |
| Year 40 | 75% | €5.094.854 | €2.241.736 | €1.838.223 |
| Year 41 | 75% | €5.247.700 | €2.308.988 | €1.893.370 |
| Year 42 | 75% | €5.405.130 | €2.378.257 | €1.950.171 |
| Year 43 | 75% | €5.567.284 | €2.449.605 | €2.008.676 |
| Year 44 | 75% | €5.734.303 | €2.523.093 | €2.068.936 |
| Year 45 | 75% | €5.906.332 | €2.598.786 | €2.131.005 |
| Year 46 | 75% | €6.083.522 | €2.676.750 | €2.194.935 |
| Year 47 | 75% | €6.266.028 | €2.757.052 | €2.260.783 |
| Year 48 | 75% | €6.454.008 | €2.839.764 | €2.328.606 |
| Year 49 | 75% | €6.647.629 | €2.924.957 | €2.398.464 |
| Year 50 | 75% | €6.847.058 | €3.012.705 | €2.470.418 |
| Year 51 | 75% | €7.052.469 | €3.103.087 | €2.544.531 |
| Year 52 | 75% | €7.264.043 | €3.196.179 | €2.620.867 |
| Year 53 | 75% | €7.481.965 | €3.292.064 | €2.699.493 |
| Year 54 | 75% | €7.706.424 | €3.390.826 | €2.780.478 |
| Year 55 | 75% | €7.937.616 | €3.492.551 | €2.863.892 |
| Year 56 | 75% | €8.175.745 | €3.597.328 | €2.949.809 |
| Year 57 | 75% | €8.421.017 | €3.705.248 | €3.038.303 |
| Year 58 | 75% | €8.673.648 | €3.816.405 | €3.129.452 |
| Year 59 | 75% | €8.933.857 | €3.930.897 | €3.223.336 |
| Year 60 | 75% | €9.201.873 | €4.048.824 | €3.320.036 |
| Year 61 | 75% | €9.477.929 | €4.170.289 | €3.419.637 |
| Year 62 | 75% | €9.762.267 | €4.295.397 | €3.522.226 |
| Year 63 | 75% | €10.055.135 | €4.424.259 | €3.627.893 |
| Year 64 | 75% | €10.356.789 | €4.556.987 | €3.736.729 |
| Year 65 | 75% | €10.667.493 | €4.693.697 | €3.848.831 |
| Year 66 | 75% | €10.987.517 | €4.834.508 | €3.964.296 |
| Year 67 | 75% | €11.317.143 | €4.979.543 | €4.083.225 |
| Year 68 | 75% | €11.656.657 | €5.128.929 | €4.205.722 |
| Year 69 | 75% | €12.006.357 | €5.282.797 | €4.331.894 |
| Year 70 | 75% | €12.366.548 | €5.441.281 | €4.461.850 |
| Year 71 | 75% | €12.737.544 | €5.604.519 | €4.595.706 |
| Year 72 | 75% | €13.119.670 | €5.772.655 | €4.733.577 |
| Year 73 | 75% | €13.513.261 | €5.945.835 | €4.875.584 |
| Year 74 | 75% | €13.918.658 | €6.124.210 | €5.021.852 |
| Year 75 | 75% | €14.336.218 | €6.307.936 | €5.172.507 |
| Year 76 | 75% | €14.766.305 | €6.497.174 | €5.327.683 |
| Year 77 | 75% | €15.209.294 | €6.692.089 | €5.487.513 |
| Year 78 | 75% | €15.665.573 | €6.892.852 | €5.652.139 |
| Year 79 | 75% | €16.135.540 | €7.099.637 | €5.821.703 |
| Year 80 | 75% | €16.619.606 | €7.312.627 | €5.996.354 |
| Year 81 | 75% | €17.118.194 | €7.532.005 | €6.176.244 |
| Year 82 | 75% | €17.631.740 | €7.757.966 | €6.361.532 |
| Year 83 | 75% | €18.160.692 | €7.990.705 | €6.552.378 |
| Year 84 | 75% | €18.705.513 | €8.230.426 | €6.748.949 |
| Year 85 | 75% | €19.266.678 | €8.477.338 | €6.951.418 |
| Year 86 | 75% | €19.844.679 | €8.731.659 | €7.159.960 |
| Year 87 | 75% | €20.440.019 | €8.993.608 | €7.374.759 |
| Year 88 | 75% | €21.053.220 | €9.263.417 | €7.596.002 |
| Year 89 | 75% | €21.684.816 | €9.541.319 | €7.823.882 |
| Year 90 | 75% | €22.335.361 | €9.827.559 | €8.058.598 |
| Year 91 | 75% | €23.005.421 | €10.122.385 | €8.300.356 |
| Year 92 | 75% | €23.695.584 | €10.426.057 | €8.549.367 |
| Year 93 | 75% | €24.406.452 | €10.738.839 | €8.805.848 |
| Year 94 | 75% | €25.138.645 | €11.061.004 | €9.070.023 |
| Year 95 | 75% | €25.892.805 | €11.392.834 | €9.342.124 |
| Year 96 | 75% | €26.669.589 | €11.734.619 | €9.622.388 |
| Year 97 | 75% | €27.469.676 | €12.086.658 | €9.911.059 |
| Year 98 | 75% | €28.293.767 | €12.449.257 | €10.208.391 |
| Year 99 | 75% | €29.142.580 | €12.822.735 | €10.514.643 |
| Year 100 | 75% | €30.016.857 | €13.207.417 | €10.830.082 |
+3.50% Annual
+2.50% Annual
11.4% Target
| ADR \ OCC | 65% | 70% | 75% | 80% | 85% |
|---|---|---|---|---|---|
| €200 | 21.3% | 22.6% | 23.9% | 25.2% | 26.5% |
| €225 | 23.4% | 24.9% | 26.3% | 27.8% | 29.2% |
| €250 | 25.5% | 27.1% | 28.7% | 30.4% | 32.0% |
| €275 | 27.6% | 29.4% | 31.2% | 33.0% | 34.7% |
| €300 | 29.7% | 31.7% | 33.6% | 35.5% | 37.5% |
Legal Disclaimer: This sensitivity analysis is based on historical market performance and projected operational standards in Nusa Penida. Actual results may vary depending on global tourism trends, local regulations, and macroeconomic factors. This is not a guarantee of future returns.
Download the full technical and financial overview of the project.
Request Data Room (NDA Required)
Famous beachside bar known for live music, sunset views, and signature cocktails.
Popular day club featuring a large pool, relaxed atmosphere, and international DJ sets.

Premium beach club near Toyapakeh harbor with direct beach access and luxury daybeds.

Iconic sunset destination offering panoramic ocean views and private bamboo nests.