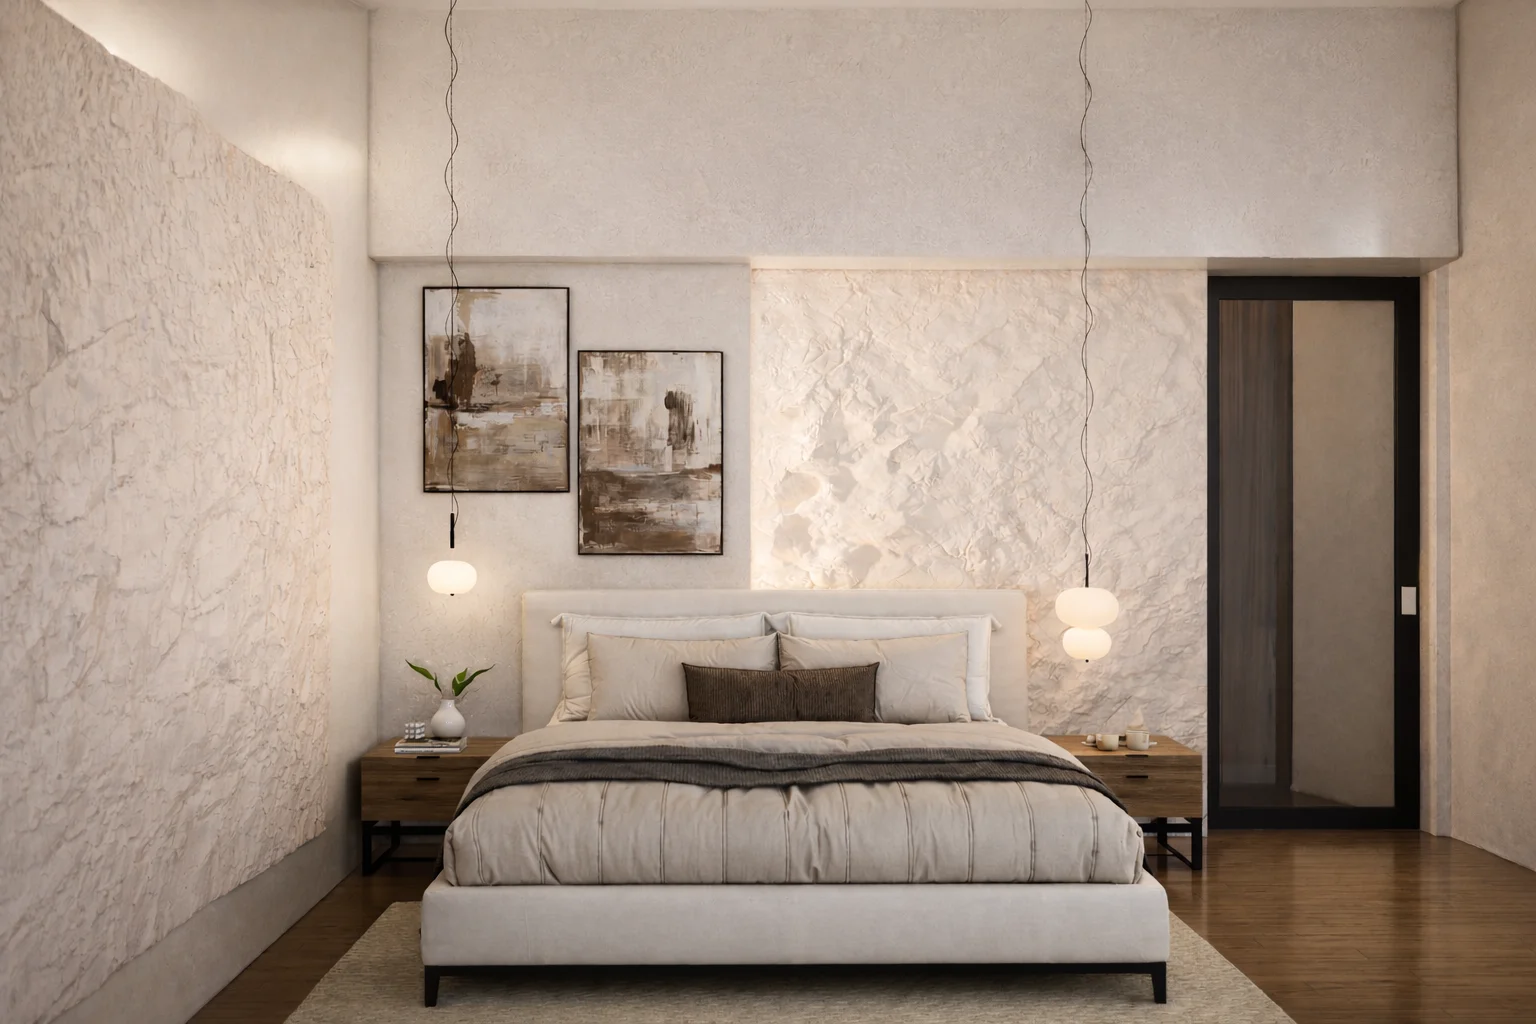
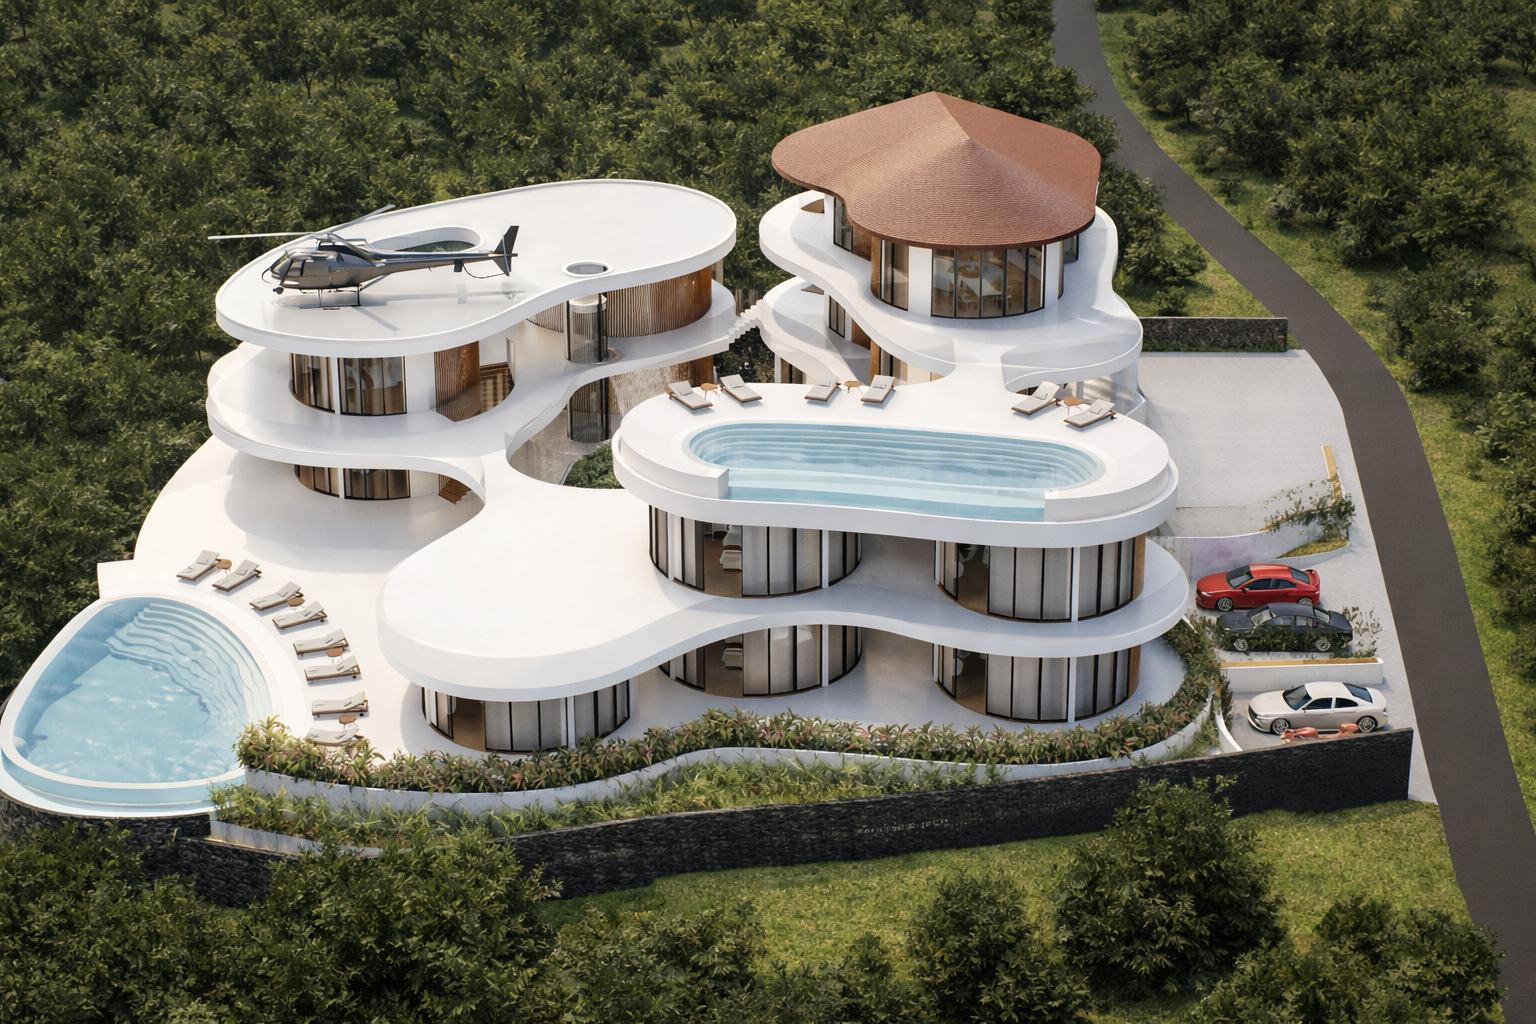
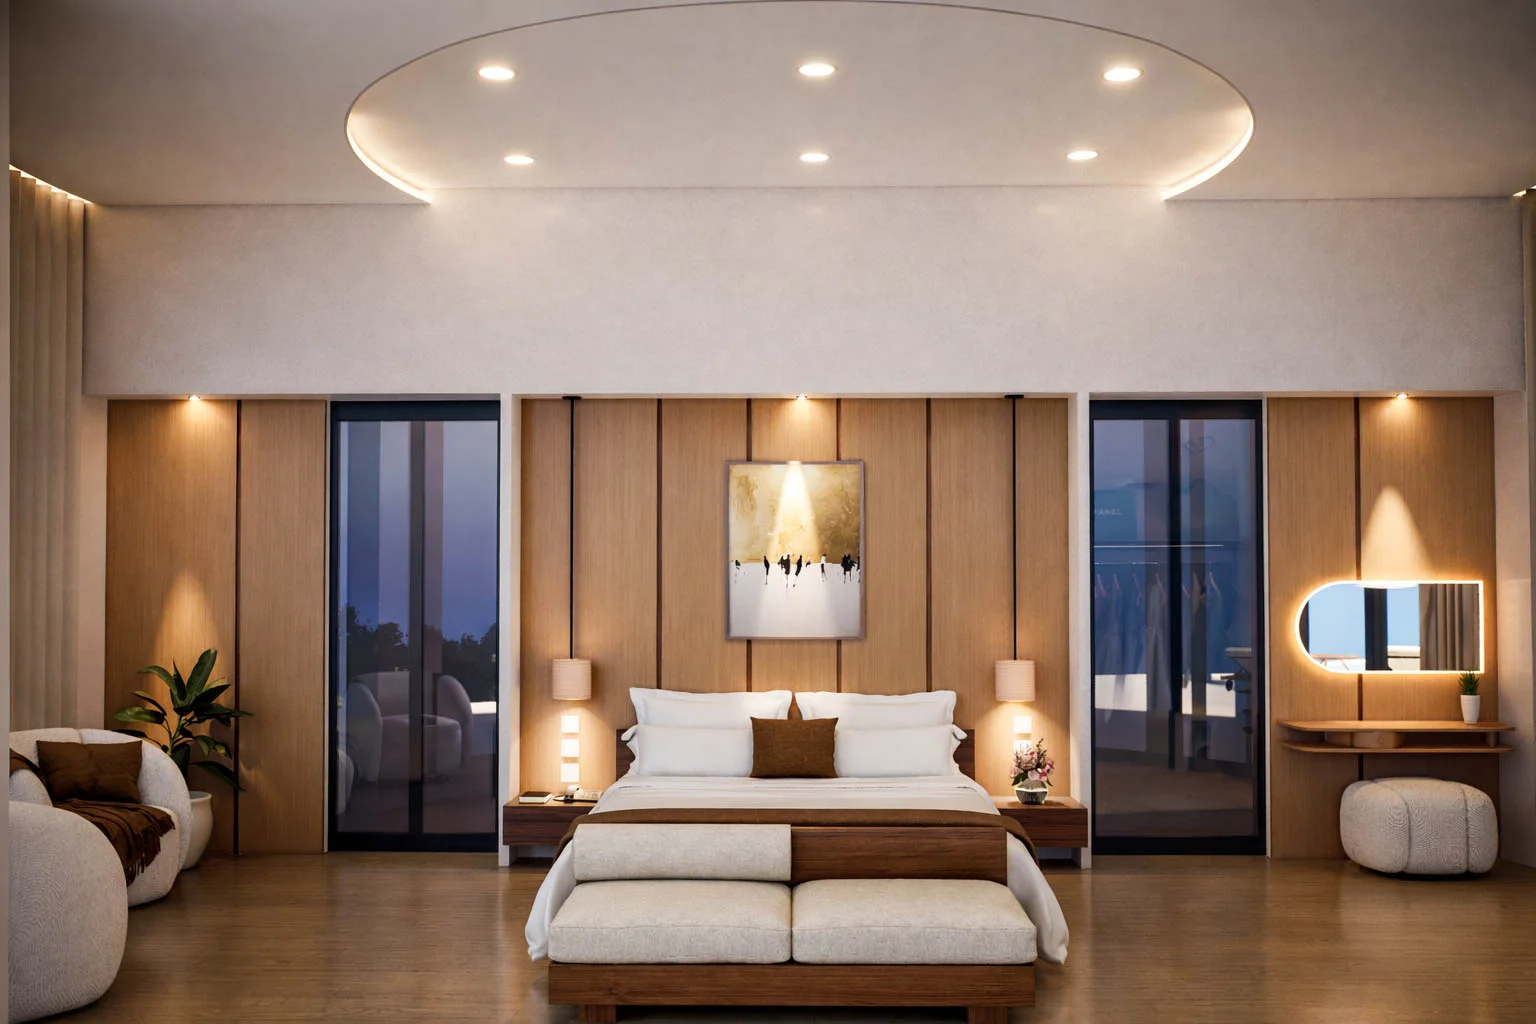
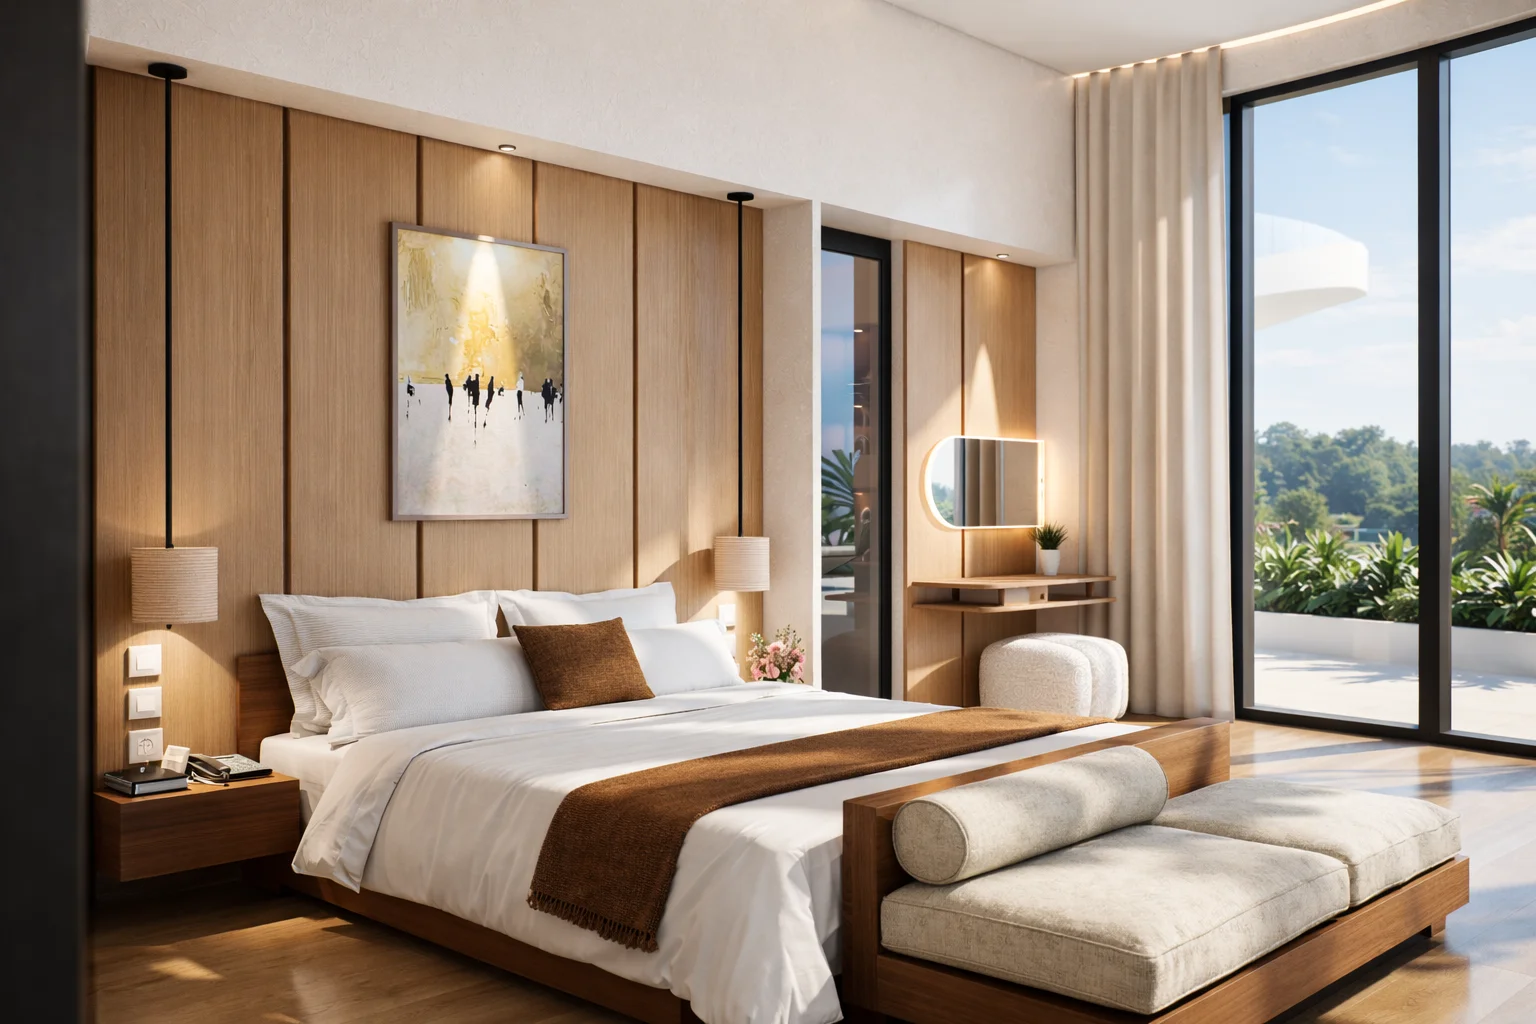
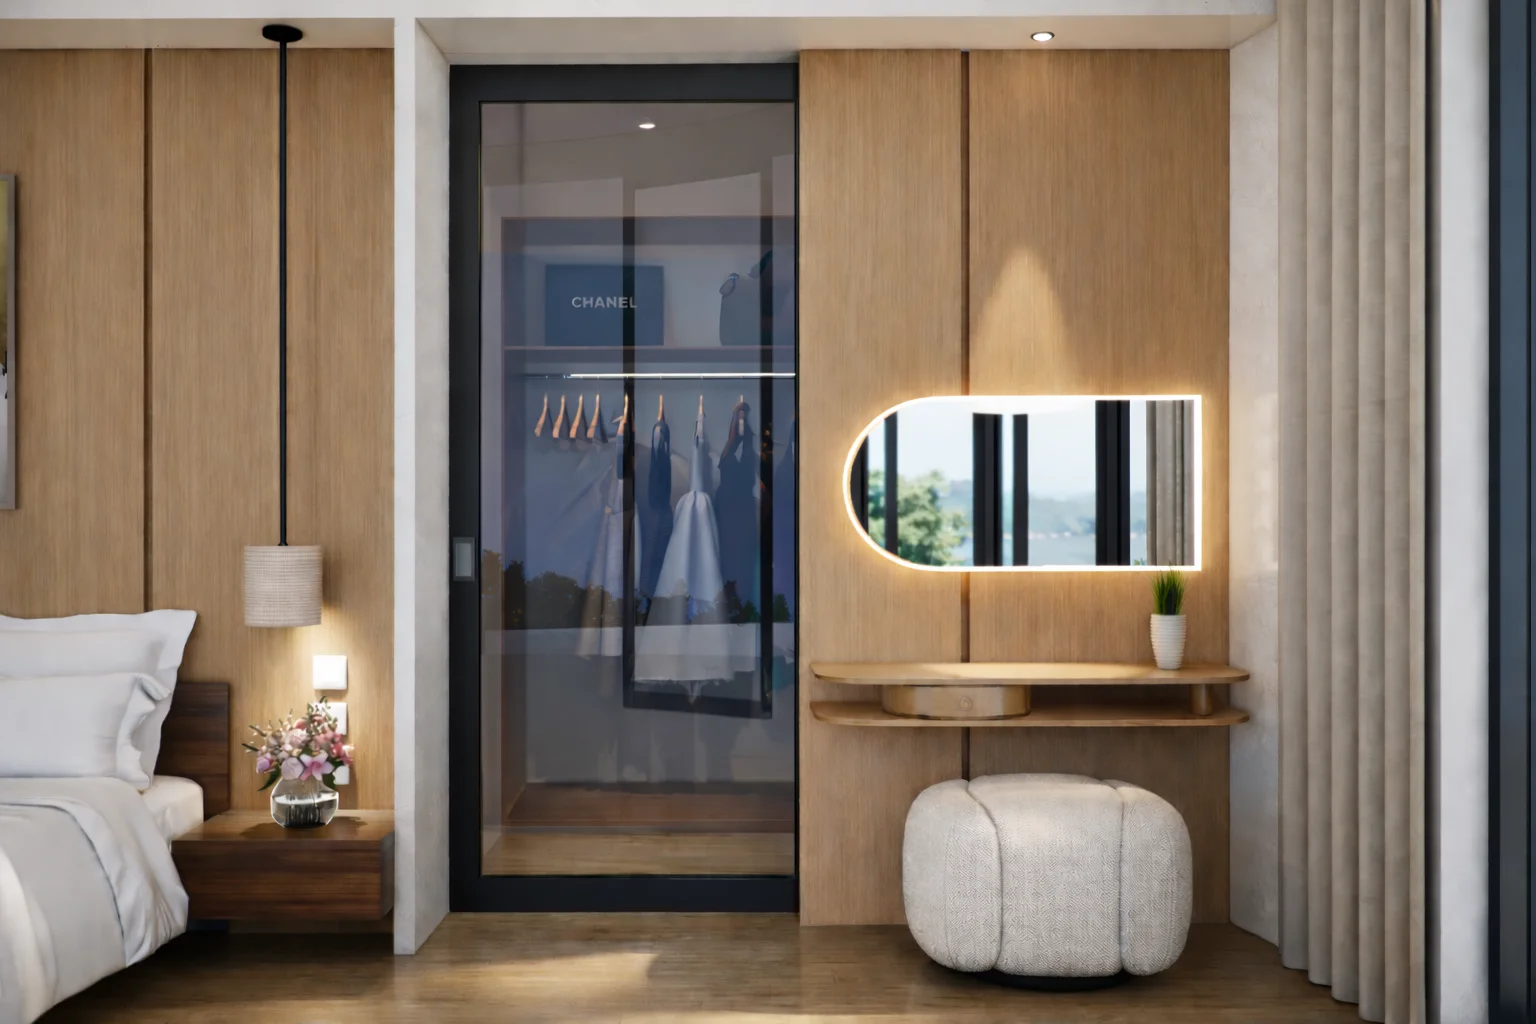
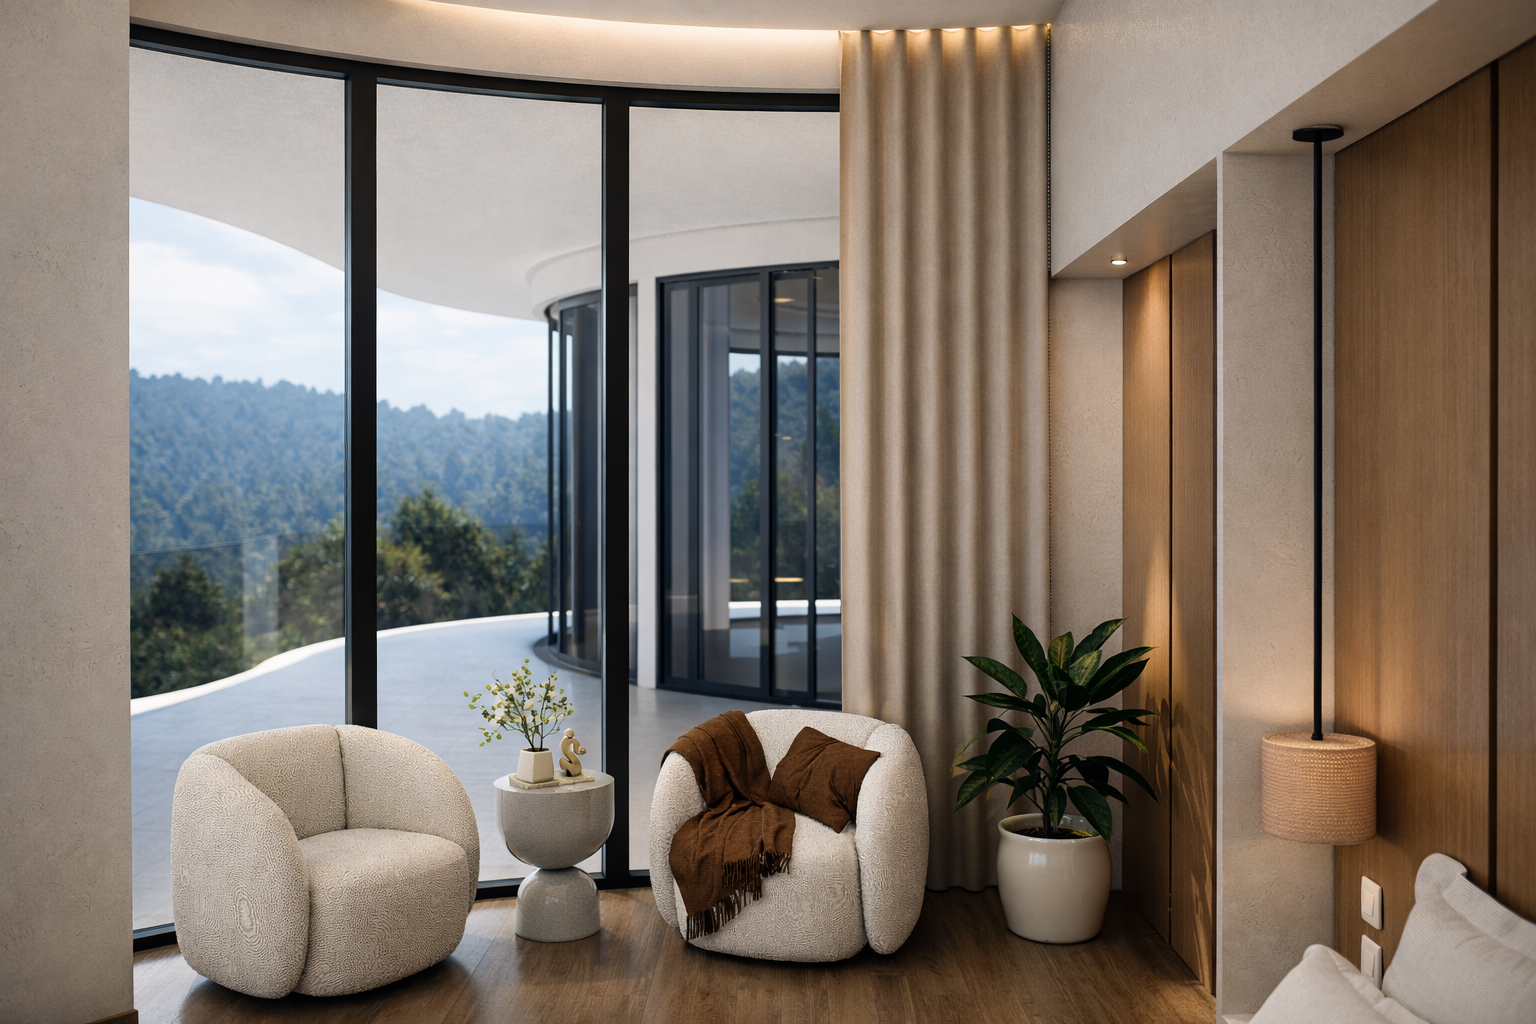
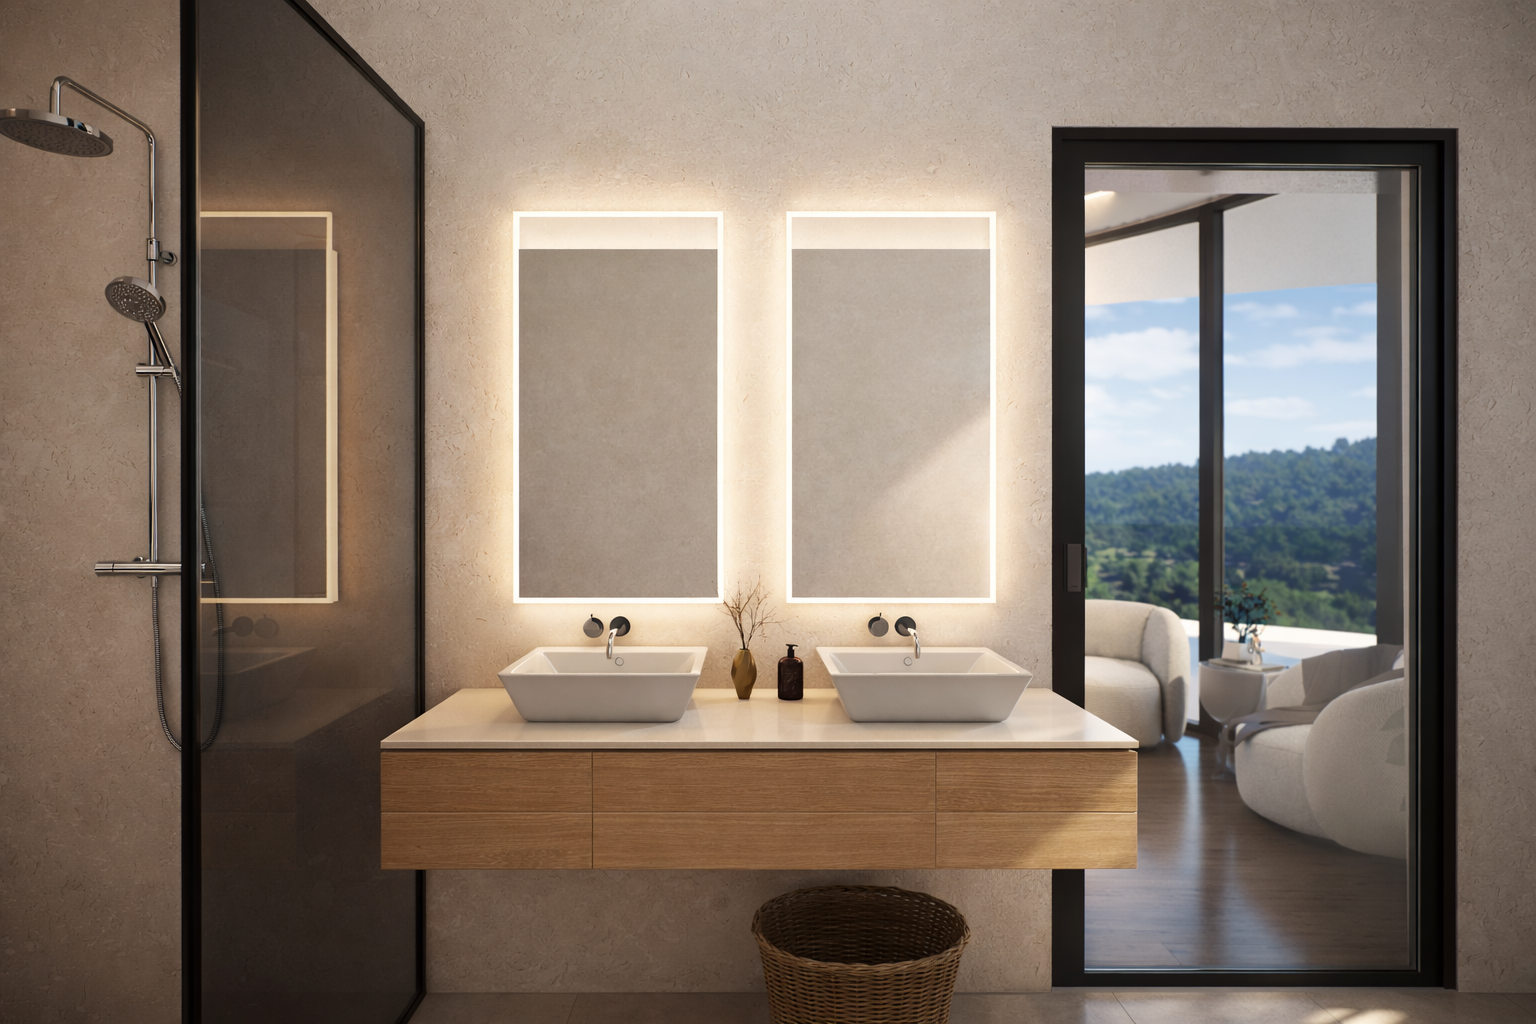
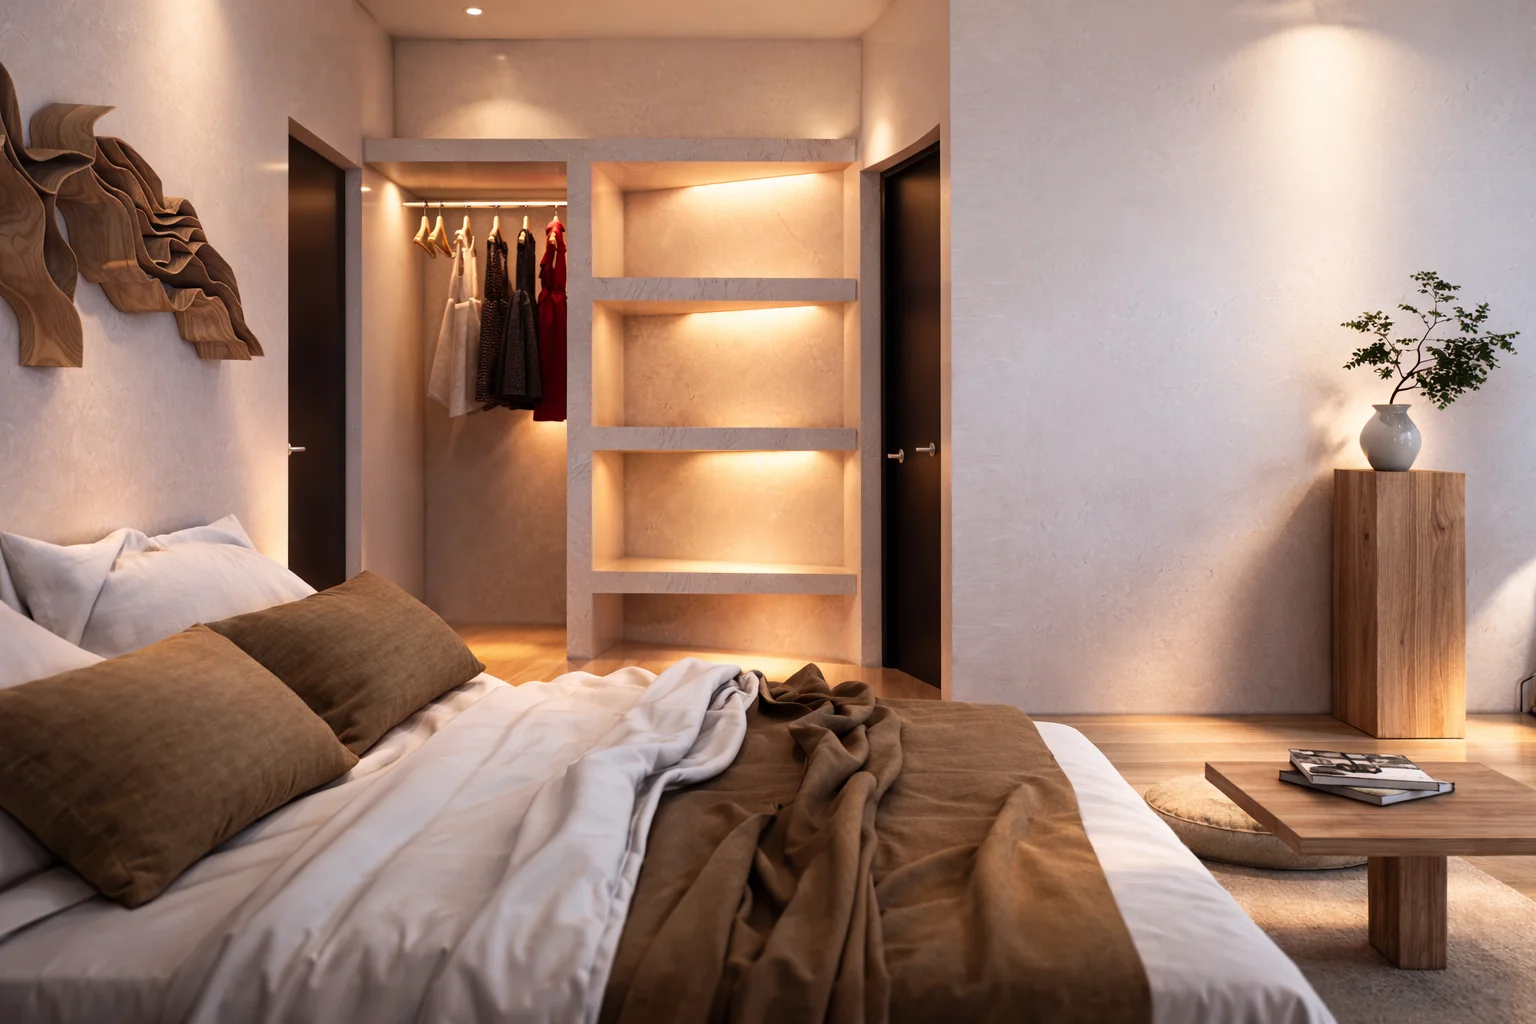
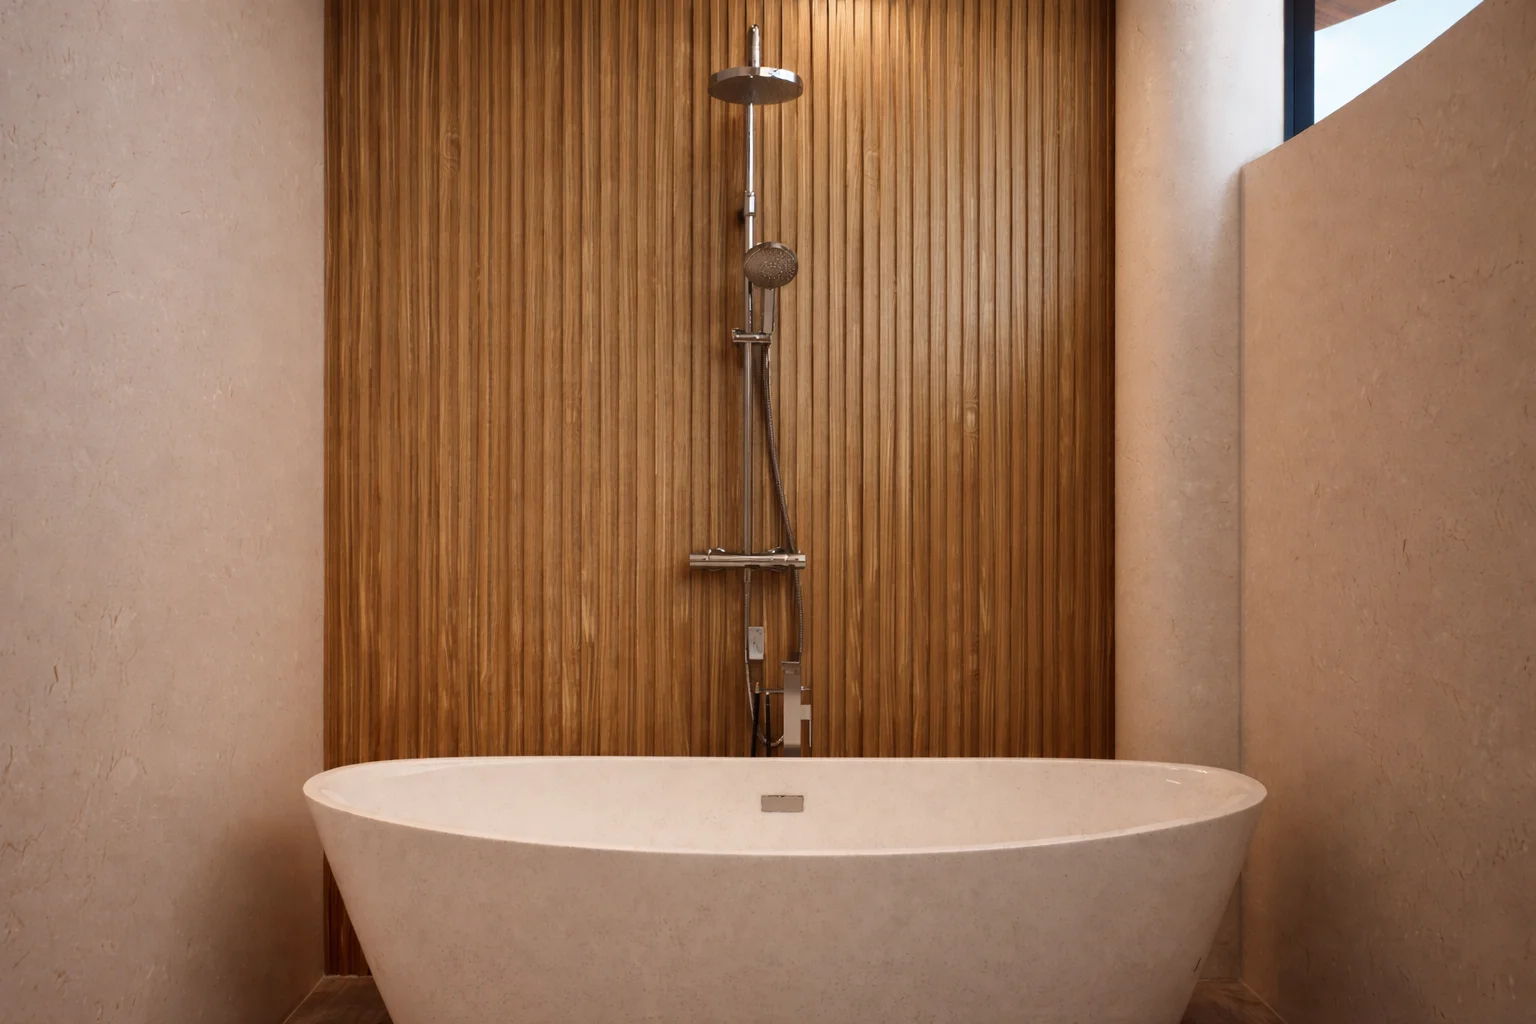
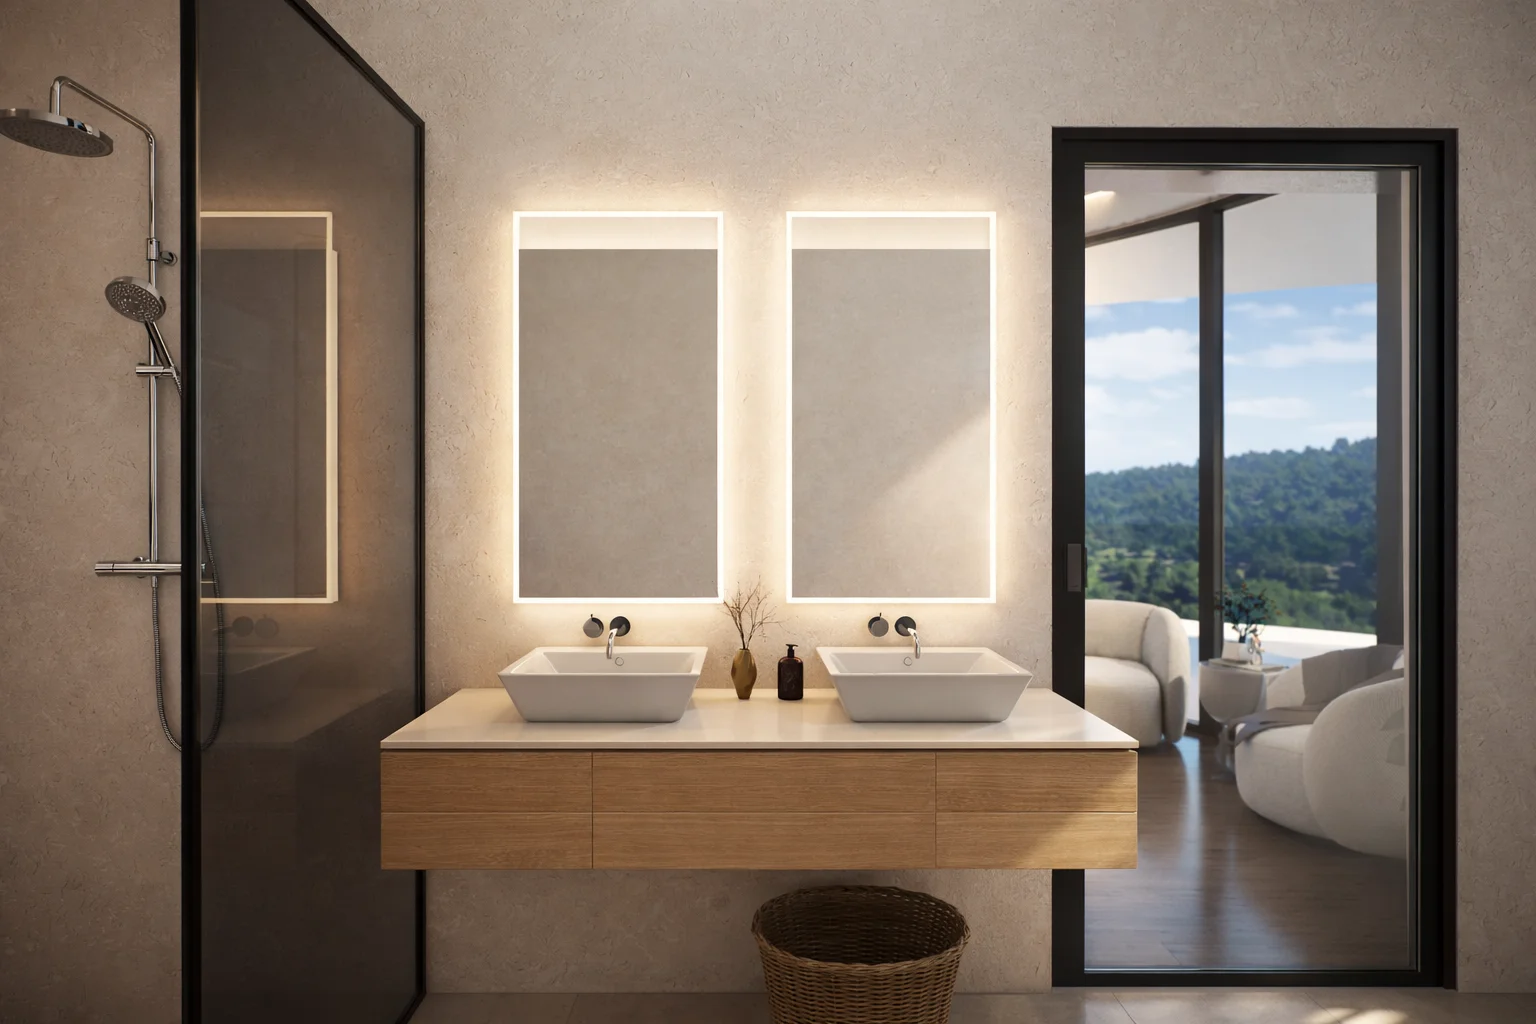
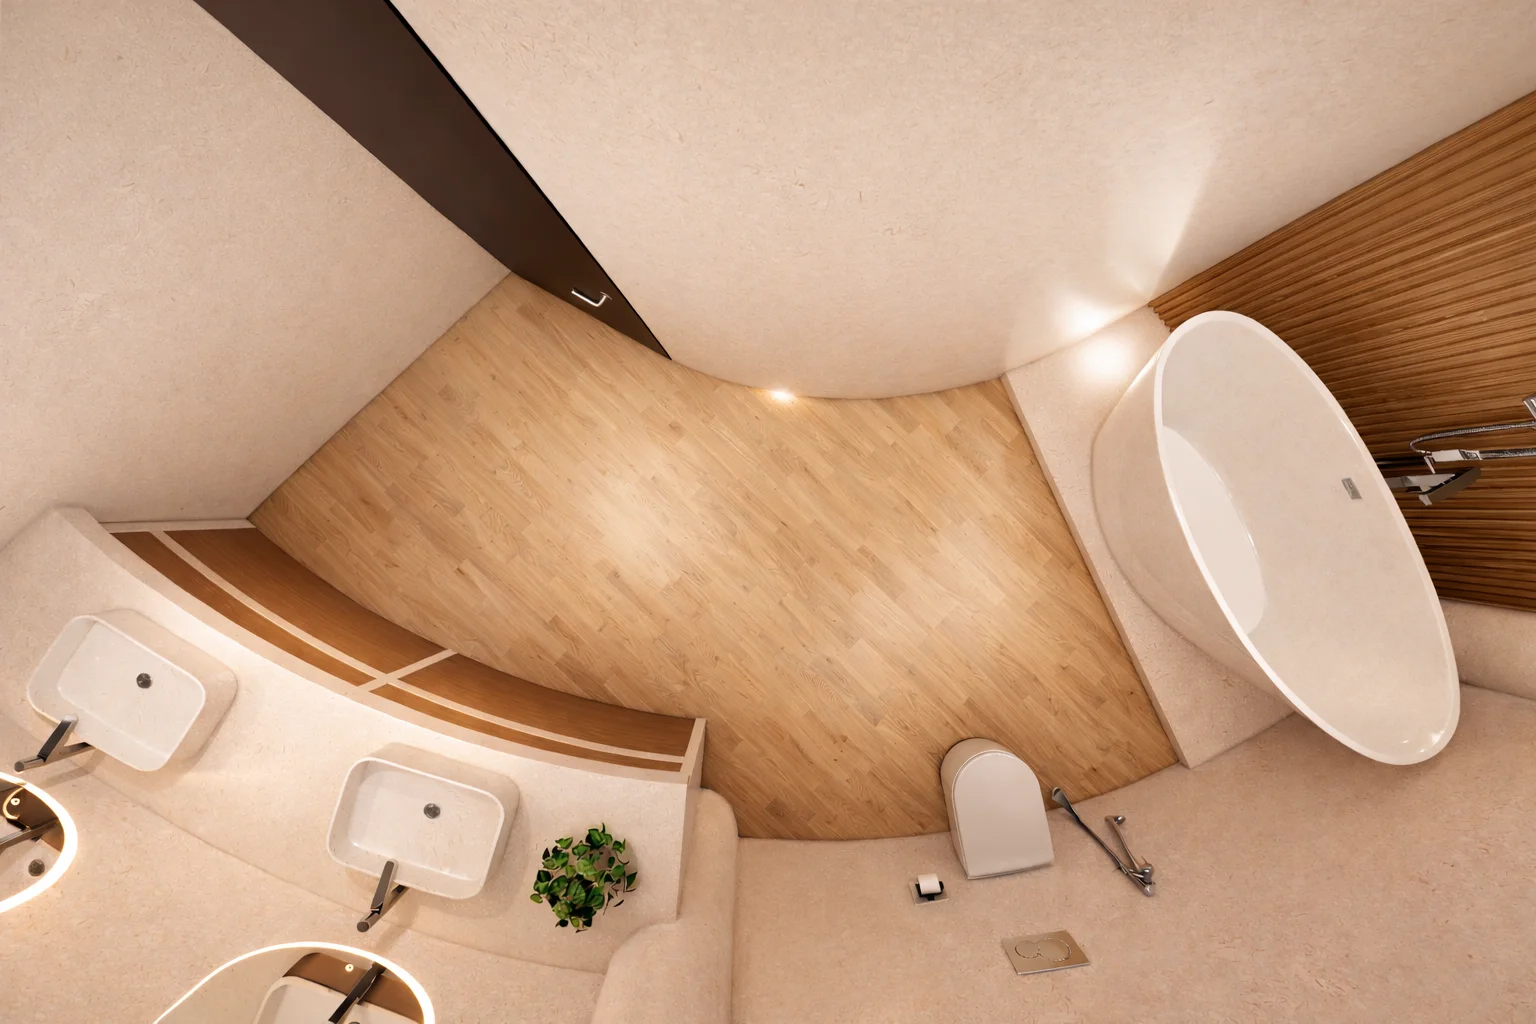
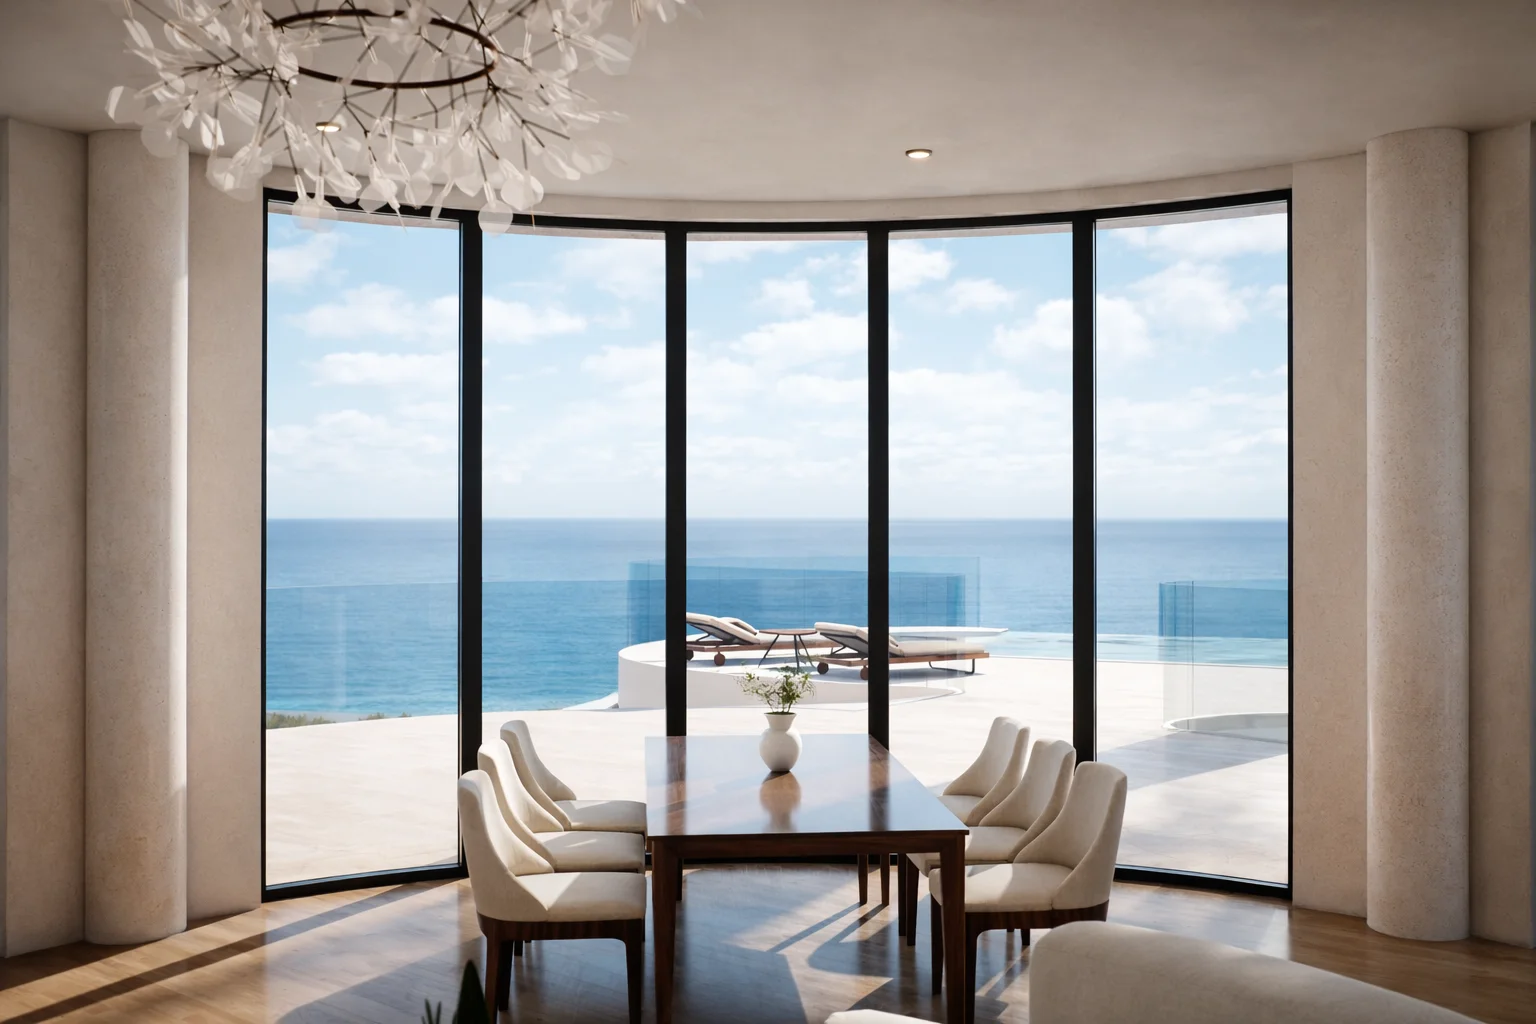
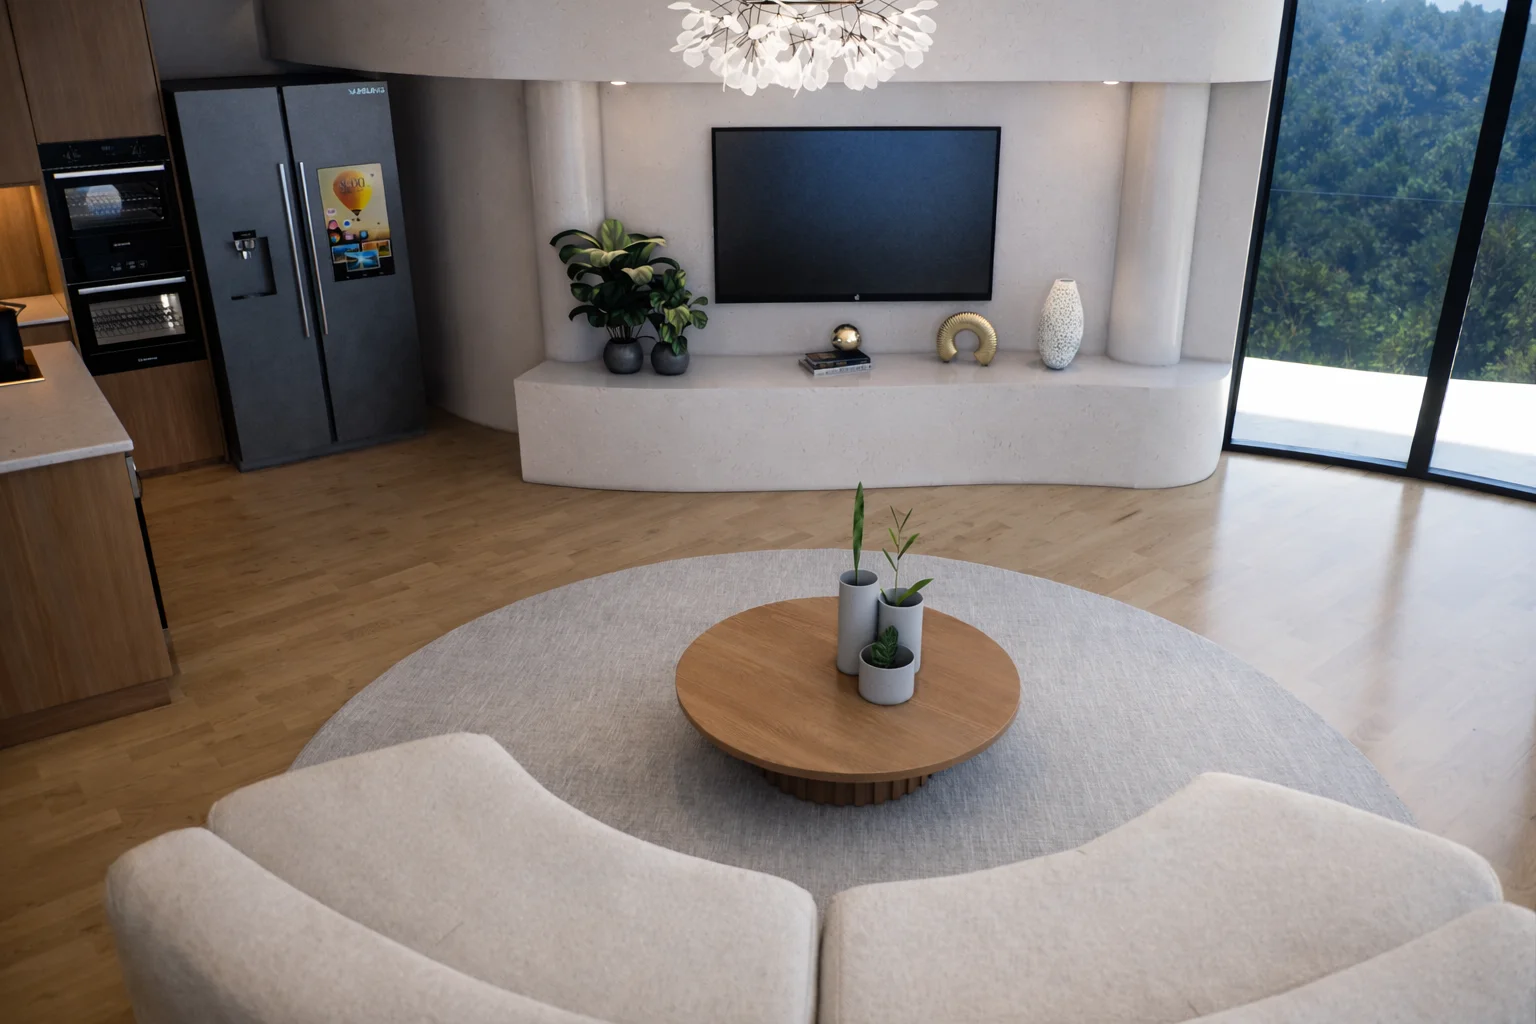
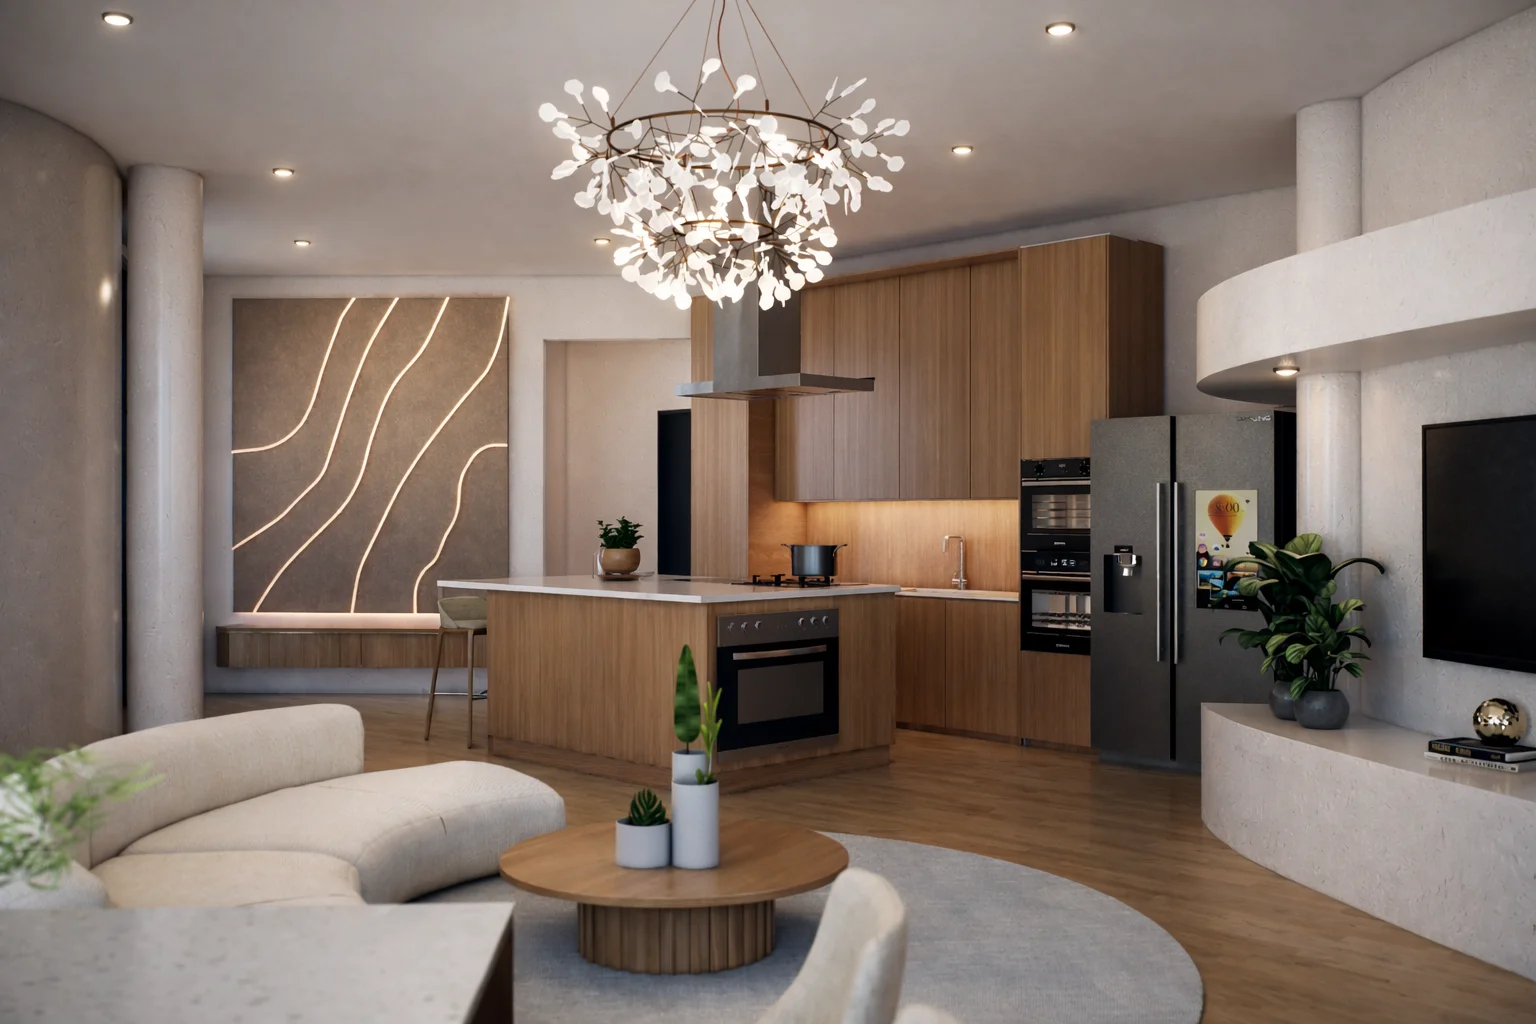
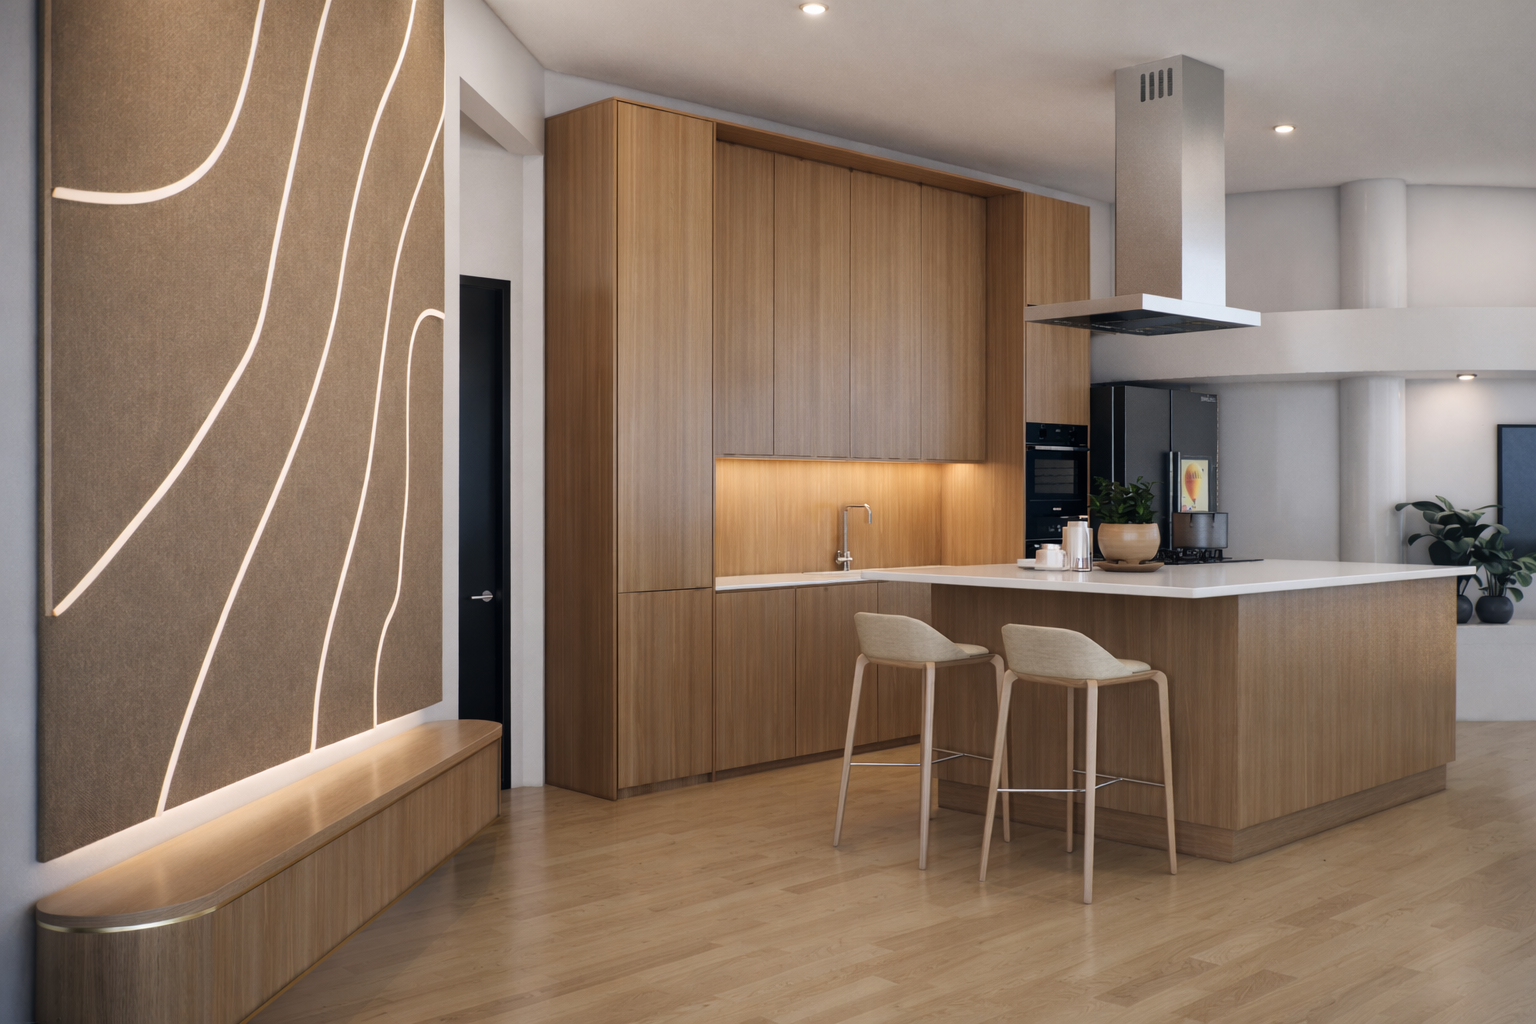
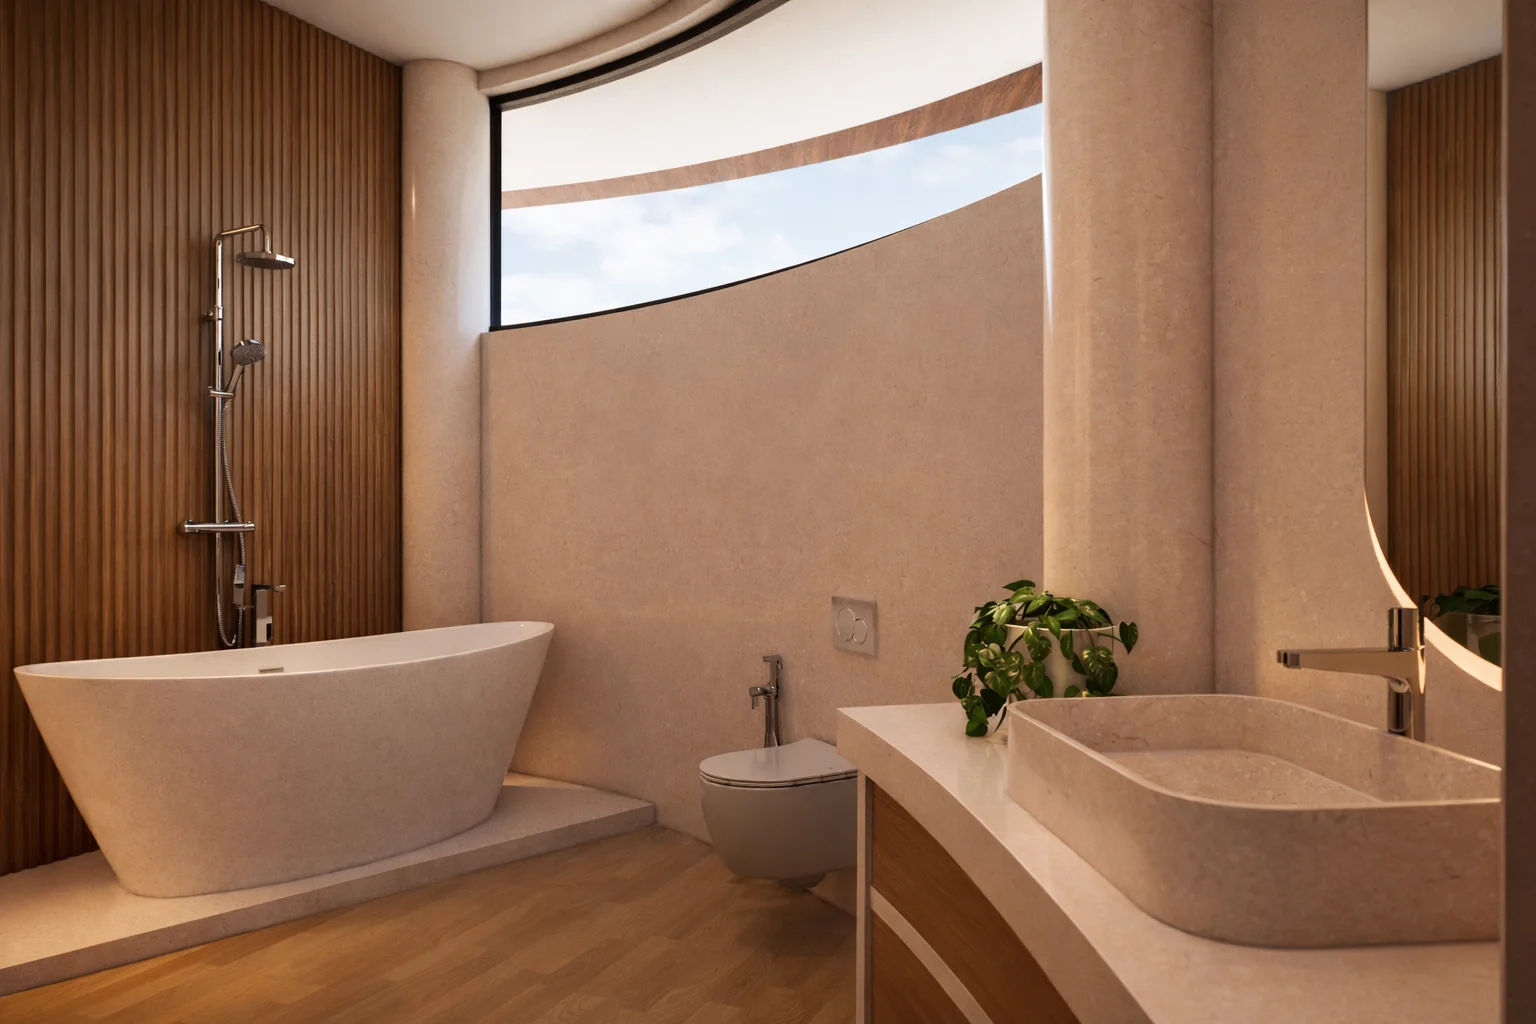
Nusa Penida Cliffside 项目堪称奢华生态旅游的巅峰之作。度假村坐落于 2400 平方米的一线临海地块,将可持续建筑美学与顶级款待服务深度融合。16 间客房均被构筑为私密避世圣地,配备私人泳池与定制室内设计,诠释室内外无缝衔接的优雅生活。
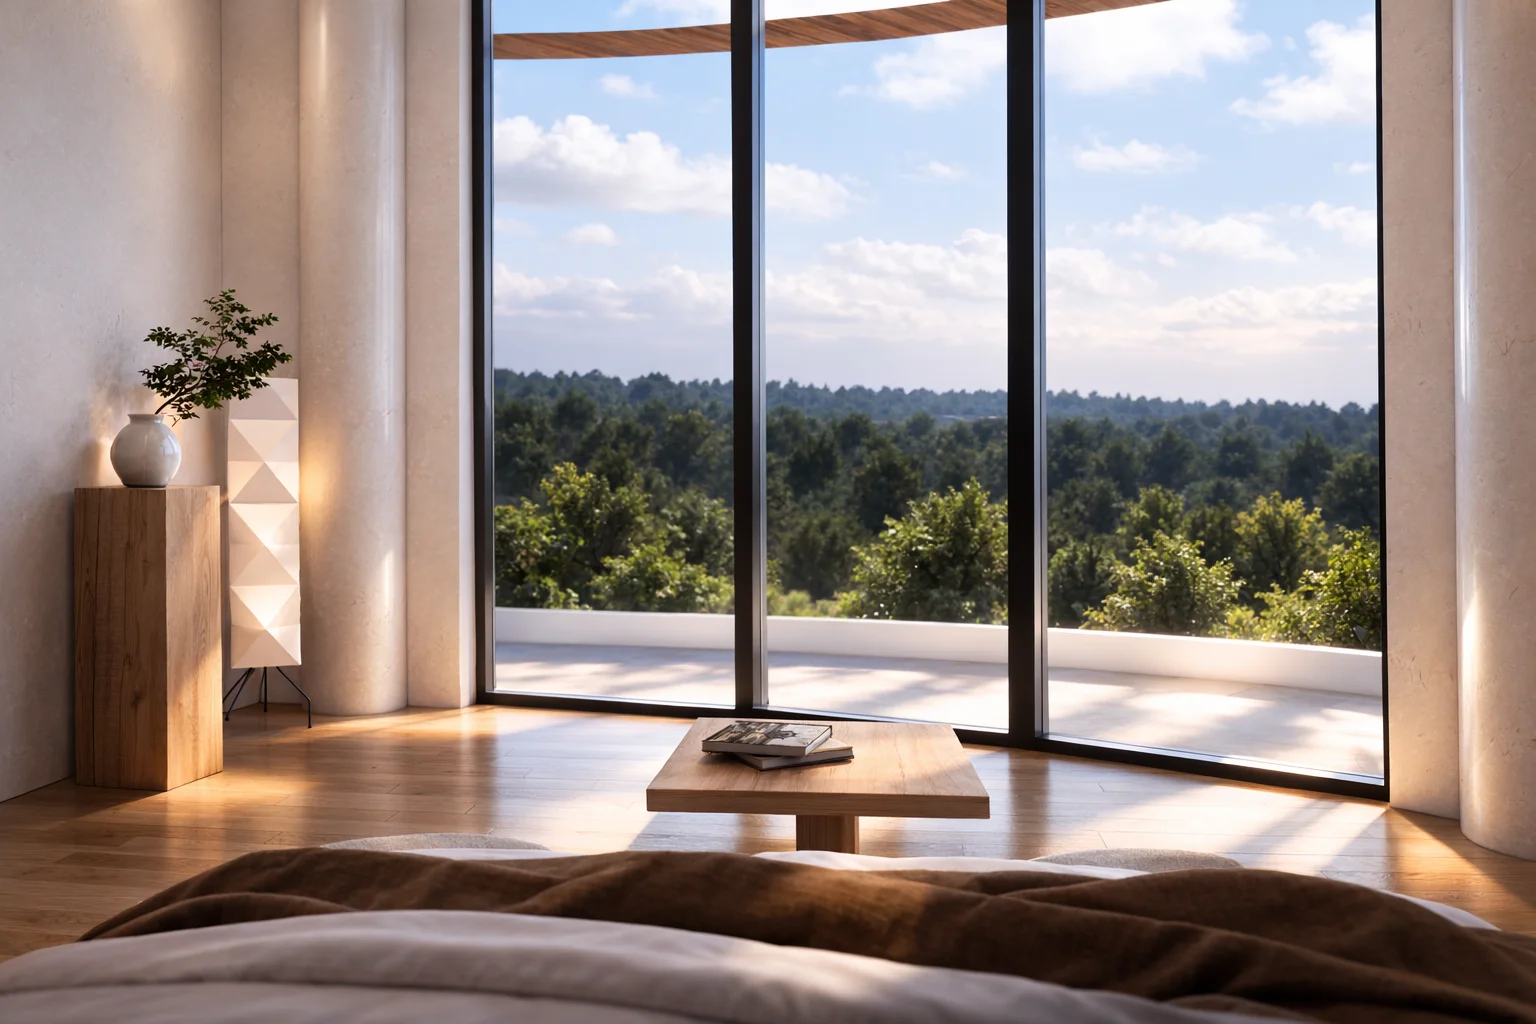
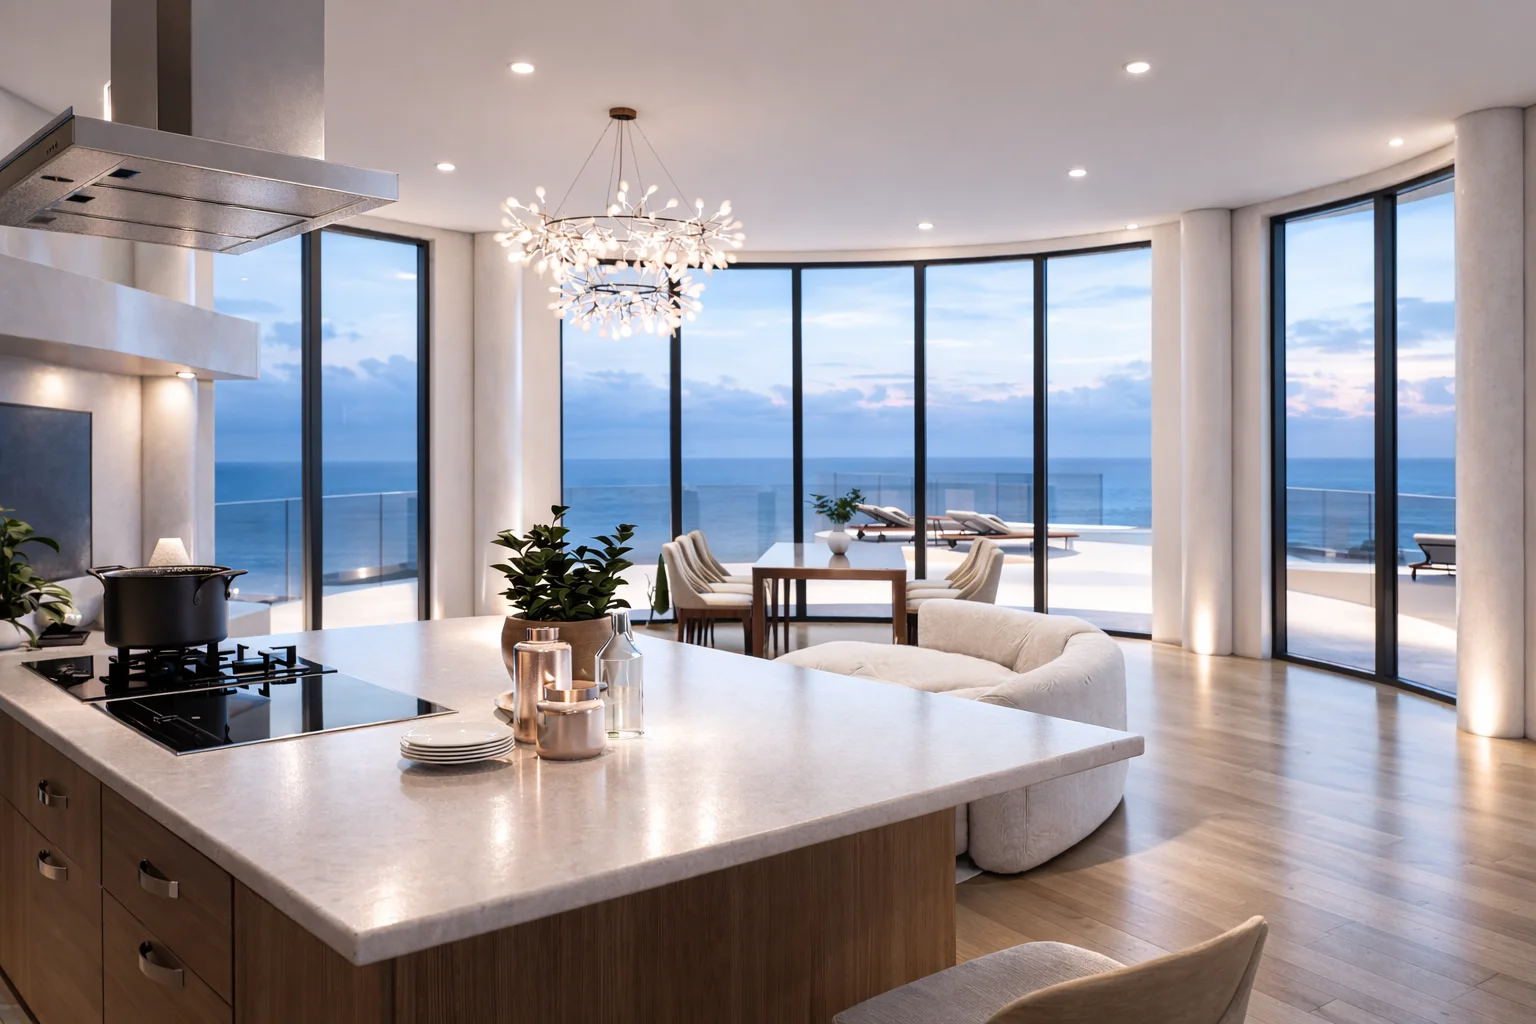
坐落于传奇之岛 Nusa Penida 悬崖之巅的顶级精品度假村,设有8栋极奢别墅,尽揽无边海景。
€3,680k
€50k
22.70%
Freehold
Discover the mix of premium villas and suites driving the resort revenue, with average daily rates (ADR) scaled by exclusivity.
Rather than a simple average, the resort average daily rate (ADR) of €411.25 is calculated dynamically using a weighted average based on inventory mix. This yields highly precise, risk-adjusted yield pro-formas.
In luxury boutique operations, rooms drive only a portion of total yield. Pro-formas integrate additional revenue streams calculated as ratios of room revenues:
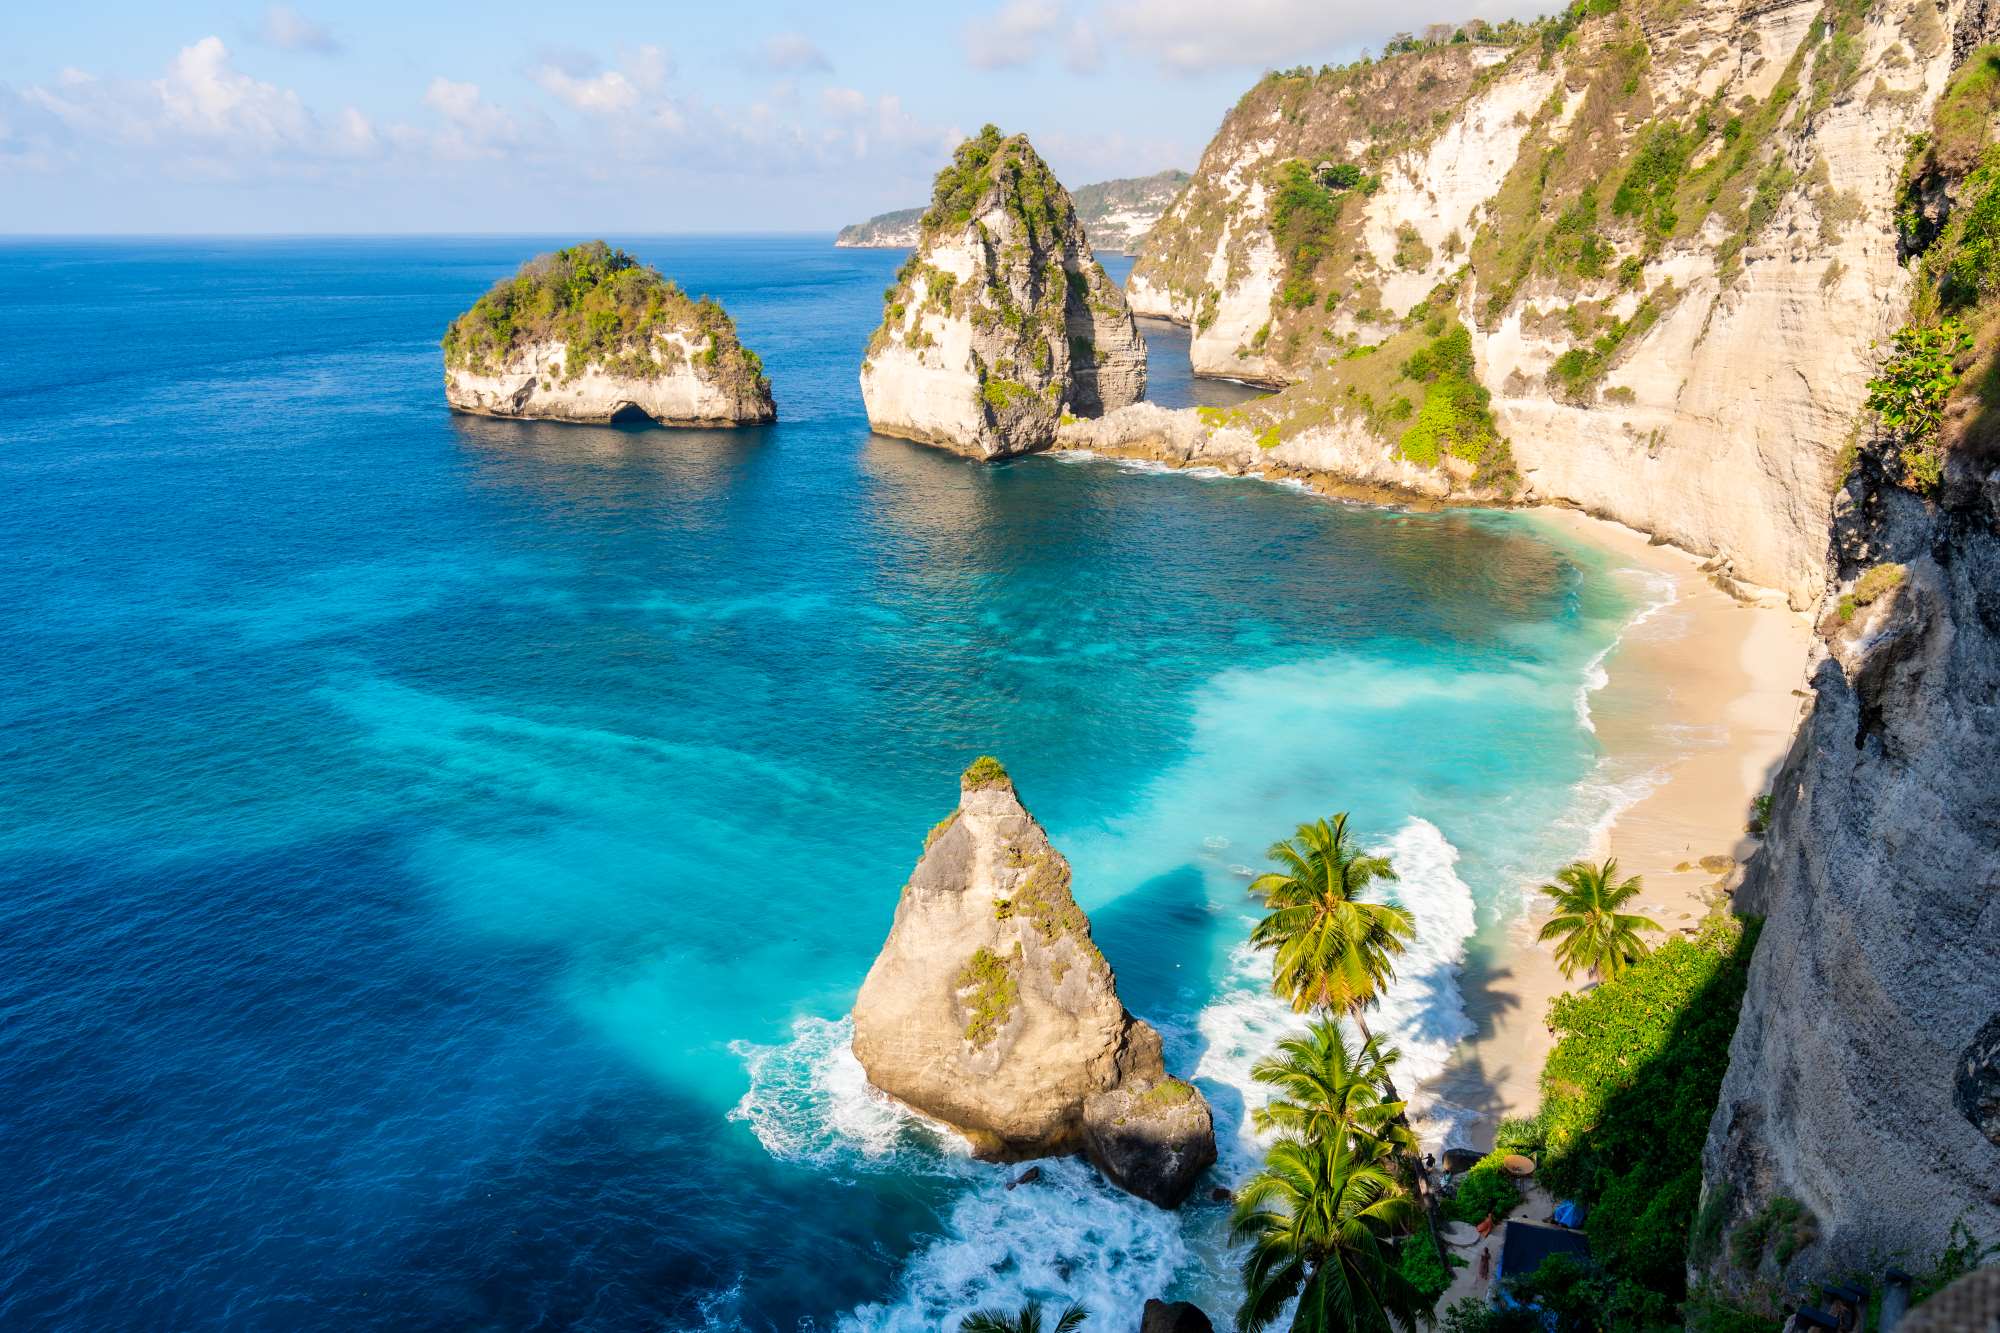
佩尼达岛:巴厘岛生态奢华旅游的新晋核心,高端旅游需求正经历创纪录的增长。


| Metric | Value |
|---|---|
| Land Cost | €0 (est.) |
| Construction Cost | €0 (est.) |
| Development Cost | €0 (est.) |
| Projected Exit Value | €0 (est.) |
| ROI | 22.70% |
| Timeline | 18 Months |
基于真实市场数据的战略分析:从一日游模式向高端奢华长居体验的转型。
本项目定位于 Nusa Penida 高端款待业市场的顶端,依托独特的悬崖地理优势,确保了极致的私密性与壮丽景观。Domo 建筑风格不仅是美学表达,更是确保日均房价(ADR)高于市场平均水平的战略抉择。
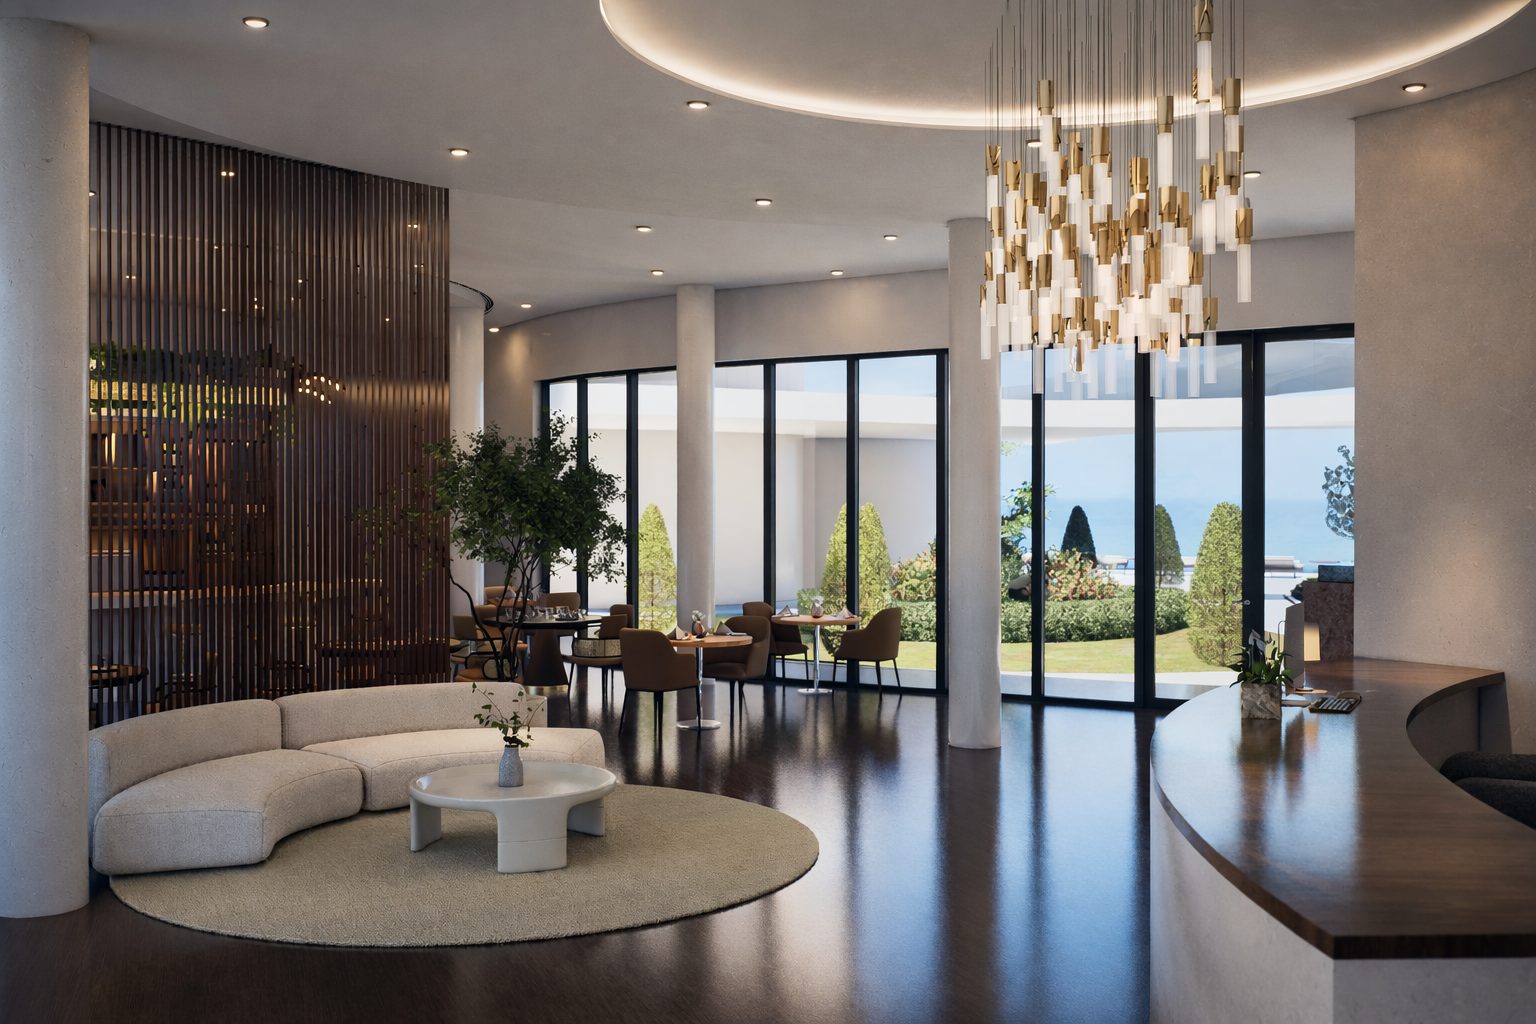
我们采用精益管理模式,旨在降低固定成本并实现息税折旧摊销前利润(EBITDA)率的最大化。度假村的低密度设计实现了优化的员工宾客比,在无需承担大型酒店综合体沉重固定成本的前提下,确保提供顶级服务。
Nusa Penida 的到访人数已从2017年的20万增长至2024年的110多万。核心转变在于客群从“走马观花”式旅游向长期奢华居停的转型。机构投资者与日益增长的“慢旅行”群体正寻求专属的低密度空间。通过占据核心悬崖地段,我们精准捕捉了该岛奢华市场爆发的早期成熟阶段,预见其资本增值潜力将超越 Canggu 等饱和市场。
Simulate your returns by adjusting the investment amount below.
27.1%
€1.9M
44.0%
5 Years
Year 7
€4.0M
€27.100
Based on IRR 27.1%The project is designed as a low-density, high-margin boutique resort, optimizing both pricing and operational efficiency. Revenue is driven by premium positioning, ocean-view units, and strong demand for experiential hospitality in Nusa Penida.
Operating costs are controlled through a lean operational model and selective outsourcing of non-core services, ensuring maximum conversion to EBITDA.
>Nusa Penida is one of Bali’s fastest-growing destinations, with increasing demand for high-end, design-driven accommodations.
Nusa Penida Cliffside 预计平均每日房价(ADR)为 550 欧元(加权平均值)。得益于其绝佳的悬崖地理位置,以及 Antonio Rutilio Architecture & Design 标志性的三层建筑设计,这一价格定位极具说服力。 凭借仅 16 间私人泳池套房的稀缺性,该度假村的定位远超当地市场平均水平(ADR 350 欧元),旨在吸引全球高净值客群,并确保 75% 的稳定入住率。
The project targets a stabilized EBITDA margin of approximately 40–45%, generating consistent annual cash flow. Investors benefit from:
The project adopts a conservative financial approach with realistic occupancy and pricing assumptions.
Reducing operational complexity and staff overhead.
Architectural identity supporting premium ADR.
Accommodation, F&B, and Wellness revenue streams.
Direct sponsor involvement in development & control.
Disclaimer: This material is for informational purposes only and does not constitute an offer or solicitation to invest. Details are provided upon request for qualified partners.
This chart represents the strategic distribution of the €3.680.000 total investment. Architecture, land rights, and construction phases are prioritized to ensure asset longevity and premium positioning.
| Category | Investment Item | Amount |
|---|---|---|
| Land Acquisition | Freehold Acquisition | €720.000 |
| Construction | Main Structure & Roof | €1.500.000 |
| Furniture & Interiors | Elite FF&E Package | €450.000 |
| Other | Safety Reserve | €290.000 |
| Design & Architecture | Architectural & Technical Design | €300.000 |
| Furniture & Interiors | Lighting & decoration | €80.000 |
| Furniture & Interiors | Equipment (AC, system) | €120.000 |
| Project Management | Project management | €70.000 |
| Design & Architecture | Engineering consultant | €50.000 |
| Permits & Legal | Building permits & licenses | €60.000 |
| Permits & Legal | Legal & company setup | €15.000 |
| Other | Staff training & hiring | €25.000 |
| ESTIMATED TOTAL CAPITAL | €3.680.000 | |
These figures represent institutional benchmarks for the location and asset class. Scenario Mode shifts these variables to simulate risk.
Total gross income generated over the project lifecycle.
Net capital remaining after all costs and investment recovery.
Performance operative excluding non-cash items and taxes.
Net profit share attributable to your specific investment.
Full capital recovery achieved before stabilization phase. This model illustrates a balanced risk-return profile, with strong cash flow generation and clear capital recovery timeline.
| Year | Estimated Occupancy | Gross Revenue | Operational Profit (EBITDA) | Net Cash Flow |
|---|---|---|---|---|
| Year 1 | 55% | €1.212.028 | €387.849 | €318.036 |
| Year 2 | 65% | €1.475.369 | €531.133 | €435.529 |
| Year 3 | 75% | €1.751.932 | €700.773 | €574.634 |
| Year 4 | 77% | €1.849.555 | €776.813 | €636.987 |
| Year 5 | 75% | €1.851.097 | €814.483 | €667.876 |
| Year 6 | 75% | €1.900.680 | €836.299 | €685.766 |
| Year 7 | 75% | €1.950.263 | €858.116 | €703.655 |
| Year 8 | 75% | €1.999.846 | €879.932 | €721.545 |
| Year 9 | 75% | €2.049.429 | €901.749 | €739.434 |
| Year 10 | 75% | €2.099.012 | €923.565 | €757.324 |
| Year 11 | 75% | €2.161.983 | €951.272 | €780.043 |
| Year 12 | 75% | €2.226.842 | €979.811 | €803.445 |
| Year 13 | 75% | €2.293.647 | €1.009.205 | €827.548 |
| Year 14 | 75% | €2.362.457 | €1.039.481 | €852.374 |
| Year 15 | 75% | €2.433.331 | €1.070.665 | €877.946 |
| Year 16 | 75% | €2.506.331 | €1.102.785 | €904.284 |
| Year 17 | 75% | €2.581.520 | €1.135.869 | €931.413 |
| Year 18 | 75% | €2.658.966 | €1.169.945 | €959.355 |
| Year 19 | 75% | €2.738.735 | €1.205.043 | €988.136 |
| Year 20 | 75% | €2.820.897 | €1.241.195 | €1.017.780 |
| Year 21 | 75% | €2.905.524 | €1.278.431 | €1.048.313 |
| Year 22 | 75% | €2.992.690 | €1.316.783 | €1.079.762 |
| Year 23 | 75% | €3.082.470 | €1.356.287 | €1.112.155 |
| Year 24 | 75% | €3.174.945 | €1.396.976 | €1.145.520 |
| Year 25 | 75% | €3.270.193 | €1.438.885 | €1.179.886 |
| Year 26 | 75% | €3.368.299 | €1.482.051 | €1.215.282 |
| Year 27 | 75% | €3.469.348 | €1.526.513 | €1.251.741 |
| Year 28 | 75% | €3.573.428 | €1.572.308 | €1.289.293 |
| Year 29 | 75% | €3.680.631 | €1.619.478 | €1.327.972 |
| Year 30 | 75% | €3.791.050 | €1.668.062 | €1.367.811 |
| Year 31 | 75% | €3.904.781 | €1.718.104 | €1.408.845 |
| Year 32 | 75% | €4.021.925 | €1.769.647 | €1.451.110 |
| Year 33 | 75% | €4.142.582 | €1.822.736 | €1.494.644 |
| Year 34 | 75% | €4.266.860 | €1.877.418 | €1.539.483 |
| Year 35 | 75% | €4.394.866 | €1.933.741 | €1.585.668 |
| Year 36 | 75% | €4.526.712 | €1.991.753 | €1.633.238 |
| Year 37 | 75% | €4.662.513 | €2.051.506 | €1.682.235 |
| Year 38 | 75% | €4.802.388 | €2.113.051 | €1.732.702 |
| Year 39 | 75% | €4.946.460 | €2.176.442 | €1.784.683 |
| Year 40 | 75% | €5.094.854 | €2.241.736 | €1.838.223 |
| Year 41 | 75% | €5.247.700 | €2.308.988 | €1.893.370 |
| Year 42 | 75% | €5.405.130 | €2.378.257 | €1.950.171 |
| Year 43 | 75% | €5.567.284 | €2.449.605 | €2.008.676 |
| Year 44 | 75% | €5.734.303 | €2.523.093 | €2.068.936 |
| Year 45 | 75% | €5.906.332 | €2.598.786 | €2.131.005 |
| Year 46 | 75% | €6.083.522 | €2.676.750 | €2.194.935 |
| Year 47 | 75% | €6.266.028 | €2.757.052 | €2.260.783 |
| Year 48 | 75% | €6.454.008 | €2.839.764 | €2.328.606 |
| Year 49 | 75% | €6.647.629 | €2.924.957 | €2.398.464 |
| Year 50 | 75% | €6.847.058 | €3.012.705 | €2.470.418 |
| Year 51 | 75% | €7.052.469 | €3.103.087 | €2.544.531 |
| Year 52 | 75% | €7.264.043 | €3.196.179 | €2.620.867 |
| Year 53 | 75% | €7.481.965 | €3.292.064 | €2.699.493 |
| Year 54 | 75% | €7.706.424 | €3.390.826 | €2.780.478 |
| Year 55 | 75% | €7.937.616 | €3.492.551 | €2.863.892 |
| Year 56 | 75% | €8.175.745 | €3.597.328 | €2.949.809 |
| Year 57 | 75% | €8.421.017 | €3.705.248 | €3.038.303 |
| Year 58 | 75% | €8.673.648 | €3.816.405 | €3.129.452 |
| Year 59 | 75% | €8.933.857 | €3.930.897 | €3.223.336 |
| Year 60 | 75% | €9.201.873 | €4.048.824 | €3.320.036 |
| Year 61 | 75% | €9.477.929 | €4.170.289 | €3.419.637 |
| Year 62 | 75% | €9.762.267 | €4.295.397 | €3.522.226 |
| Year 63 | 75% | €10.055.135 | €4.424.259 | €3.627.893 |
| Year 64 | 75% | €10.356.789 | €4.556.987 | €3.736.729 |
| Year 65 | 75% | €10.667.493 | €4.693.697 | €3.848.831 |
| Year 66 | 75% | €10.987.517 | €4.834.508 | €3.964.296 |
| Year 67 | 75% | €11.317.143 | €4.979.543 | €4.083.225 |
| Year 68 | 75% | €11.656.657 | €5.128.929 | €4.205.722 |
| Year 69 | 75% | €12.006.357 | €5.282.797 | €4.331.894 |
| Year 70 | 75% | €12.366.548 | €5.441.281 | €4.461.850 |
| Year 71 | 75% | €12.737.544 | €5.604.519 | €4.595.706 |
| Year 72 | 75% | €13.119.670 | €5.772.655 | €4.733.577 |
| Year 73 | 75% | €13.513.261 | €5.945.835 | €4.875.584 |
| Year 74 | 75% | €13.918.658 | €6.124.210 | €5.021.852 |
| Year 75 | 75% | €14.336.218 | €6.307.936 | €5.172.507 |
| Year 76 | 75% | €14.766.305 | €6.497.174 | €5.327.683 |
| Year 77 | 75% | €15.209.294 | €6.692.089 | €5.487.513 |
| Year 78 | 75% | €15.665.573 | €6.892.852 | €5.652.139 |
| Year 79 | 75% | €16.135.540 | €7.099.637 | €5.821.703 |
| Year 80 | 75% | €16.619.606 | €7.312.627 | €5.996.354 |
| Year 81 | 75% | €17.118.194 | €7.532.005 | €6.176.244 |
| Year 82 | 75% | €17.631.740 | €7.757.966 | €6.361.532 |
| Year 83 | 75% | €18.160.692 | €7.990.705 | €6.552.378 |
| Year 84 | 75% | €18.705.513 | €8.230.426 | €6.748.949 |
| Year 85 | 75% | €19.266.678 | €8.477.338 | €6.951.418 |
| Year 86 | 75% | €19.844.679 | €8.731.659 | €7.159.960 |
| Year 87 | 75% | €20.440.019 | €8.993.608 | €7.374.759 |
| Year 88 | 75% | €21.053.220 | €9.263.417 | €7.596.002 |
| Year 89 | 75% | €21.684.816 | €9.541.319 | €7.823.882 |
| Year 90 | 75% | €22.335.361 | €9.827.559 | €8.058.598 |
| Year 91 | 75% | €23.005.421 | €10.122.385 | €8.300.356 |
| Year 92 | 75% | €23.695.584 | €10.426.057 | €8.549.367 |
| Year 93 | 75% | €24.406.452 | €10.738.839 | €8.805.848 |
| Year 94 | 75% | €25.138.645 | €11.061.004 | €9.070.023 |
| Year 95 | 75% | €25.892.805 | €11.392.834 | €9.342.124 |
| Year 96 | 75% | €26.669.589 | €11.734.619 | €9.622.388 |
| Year 97 | 75% | €27.469.676 | €12.086.658 | €9.911.059 |
| Year 98 | 75% | €28.293.767 | €12.449.257 | €10.208.391 |
| Year 99 | 75% | €29.142.580 | €12.822.735 | €10.514.643 |
| Year 100 | 75% | €30.016.857 | €13.207.417 | €10.830.082 |
+3.50% Annual
+2.50% Annual
11.4% Target
| ADR \ OCC | 65% | 70% | 75% | 80% | 85% |
|---|---|---|---|---|---|
| €200 | 21.3% | 22.6% | 23.9% | 25.2% | 26.5% |
| €225 | 23.4% | 24.9% | 26.3% | 27.8% | 29.2% |
| €250 | 25.5% | 27.1% | 28.7% | 30.4% | 32.0% |
| €275 | 27.6% | 29.4% | 31.2% | 33.0% | 34.7% |
| €300 | 29.7% | 31.7% | 33.6% | 35.5% | 37.5% |
Legal Disclaimer: This sensitivity analysis is based on historical market performance and projected operational standards in Nusa Penida. Actual results may vary depending on global tourism trends, local regulations, and macroeconomic factors. This is not a guarantee of future returns.
Download the full technical and financial overview of the project.
Request Data Room (NDA Required)
Famous beachside bar known for live music, sunset views, and signature cocktails.
Popular day club featuring a large pool, relaxed atmosphere, and international DJ sets.

Premium beach club near Toyapakeh harbor with direct beach access and luxury daybeds.

Iconic sunset destination offering panoramic ocean views and private bamboo nests.