Antonio Rutilio
Kintamani Resort investment
Institutional Opportunity

Kintamani Resort investment

Kintamani, Bali

Project Overview

Lush tropical garden surrounding the Kintamani Resort villa

KINTAMANI RESORT

Project Description โ€‹

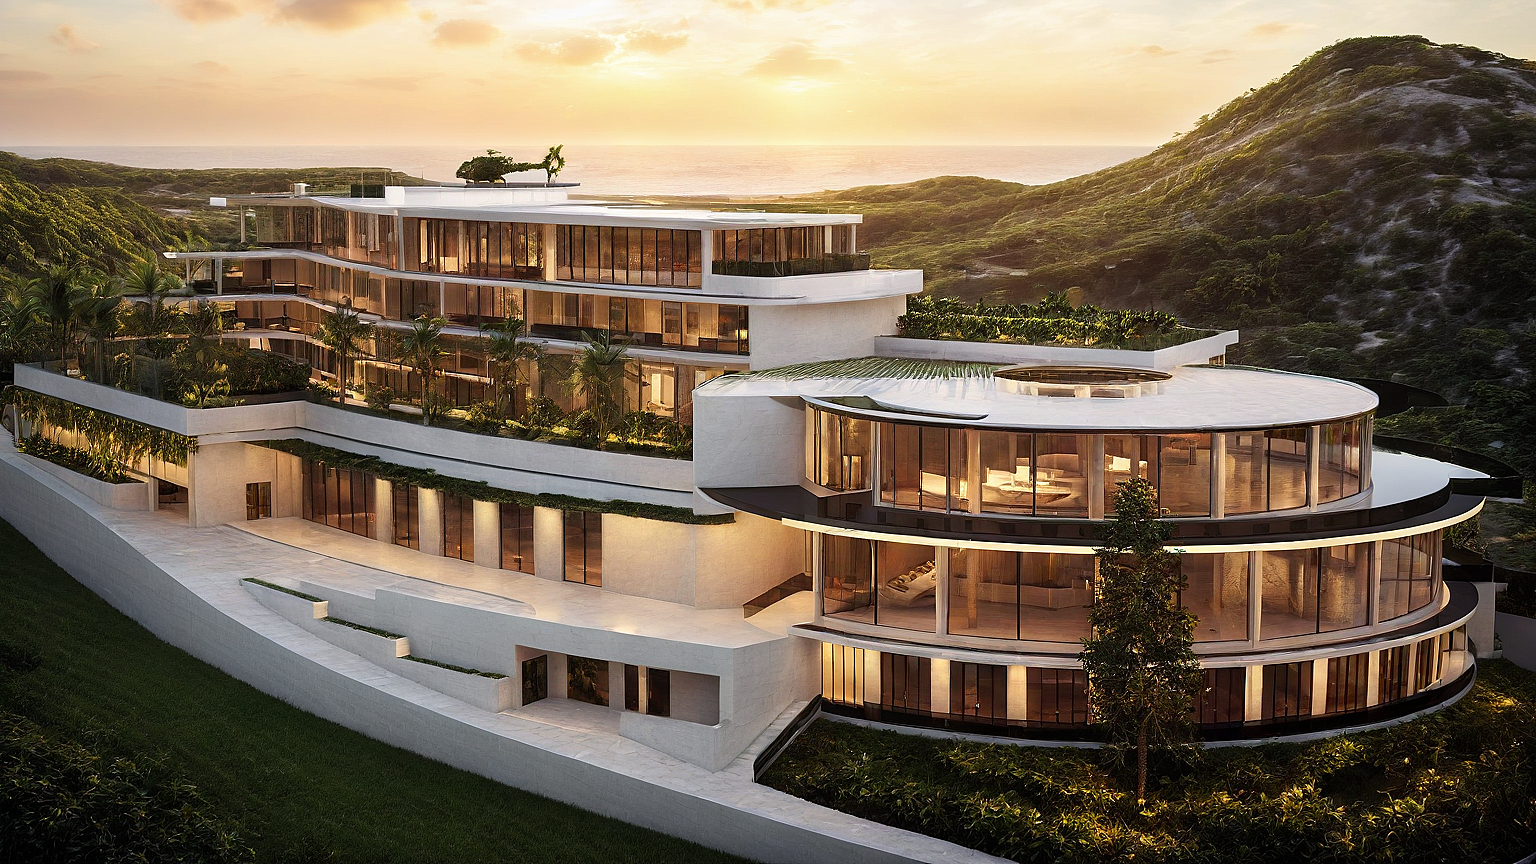
Nestled in the dramatic highlands of Kintamani, Bali, the Kintamani Resort is envisioned as a refined expression of contemporary tropical architecture. Designed by architect Antonio Rutilio, this project embraces the unique character of the volcanic terrain. Consequently, it creates a destination where modern design and natural beauty exist in perfect balance.

Architectural Concept & Vision

The design philosophy centers on total harmony with nature. Specifically, it creates a space that feels deeply connected to its environment while offering world-class luxury amenities. In addition, the architecture utilizes a refined palette of local materials, including volcanic rock and sustainable wood. As a result, these elements effectively anchor the structures within their natural setting and celebrate the raw textures of Bali.Moreover, large glass expanses and open-plan layouts characterize the resort. This approach ensures that every room offers an unobstructed view of the majestic mountains and the serene Lake Batur. Furthermore, this design approach maximizes the visual impact of the location while promoting natural ventilation.

Luxury Amenities and Indoor-Outdoor Living

Regarding the interior, the spaces focus on fluid transitions between indoor and outdoor living. For instance, spacious villas feature private infinity pools that appear to merge with the horizon. Meanwhile, communal areas are arranged to facilitate a sense of community and relaxation. Every element of the Kintamani Resort has been meticulously crafted to provide an unparalleled experience for discerning travelers. Because of this, luxury is woven into every detail from the elegantly appointed suites to the state-of-the-art spa. Ultimately, guests can enjoy a sanctuary that balances modern comfort with the untamed beauty of the highlands.
  • Client : Roman and Sergey

  • Date : September 2024 - November 2024

  • Project : Architectural, Interior & Exterior, and Rendering

Kintamani Resort Interior SuiteKintamani Resort TerraceKintamani ResortKintamani Resort Main Viewar_design_4_ar_designar_design_5_ar_designar_design_6_ar_designKintamani Resort GardenBack To Menu
Executive Summary
Target Investment

โ‚ฌ2,100k

Min Entry

โ‚ฌ25k

ROI Target

25.40%

Ownership

Leasehold

Development Roadmap

Construction starts Sep 2026
Opening 01 Dec 2025
DESIGN & DEVELOPMENT
PERMITS & LEGAL
CONSTRUCTION
PRE-OPENING & LAUNCH
Institutional Insights

Market Analysis Explorer

๐Ÿ”น Market Demand
12% - 15%
Domestic elite, Asia-Pacific
25 Days
๐Ÿ”น Pricing Dynamics
โ‚ฌ250
โ‚ฌ130
โ‚ฌ48.000
๐Ÿ”น Competitive Edge
Local Glamping Sites
Low
Direct Crater View
๐Ÿ”น Industry Trends
Sustainable Travel
Medium
Medium
๐Ÿ”น Strategy & Exit
Wholesale Acquisition
Volcanic Activity
Moderate
Elite Data Engine

Investment Snapshot

Simulate your returns by adjusting the investment amount below.

๐Ÿ’ผ My Investment (Simulator)
โ‚ฌ
Insert a value to simulate
Target IRR

49.0%

Stabilized Revenue

โ‚ฌ2.2M

EBITDA Margin

50.0%

Horizon

5 Years

Break-even

Year 4

Total Investment

โ‚ฌ2.1M

๐Ÿ“ˆ Estimated Annual Return

โ‚ฌ49.000

Based on IRR 49.0%
Interactive Simulator

Calculate Your Return

Your Equity Share

0%

Ownership Stake
Annual Passive Income

โ‚ฌ0

Stabilized Yield
Projected Liquidity (5Y)

โ‚ฌ0

Profits + Exit Payout
Exit Multiple

0.0x

Total ROI Factor
Scenario Logic

IRR Sensitivity

CONSERVATIVE14%
BASE CASE22%
UPSIDE30%
Strategic Analysis

Financial Performance

The project is designed as a low-density, high-margin boutique resort, optimizing both pricing and operational efficiency. Revenue is driven by premium positioning, ocean-view units, and strong demand for experiential hospitality in Nusa Penida.

Operating costs are controlled through a lean operational model and selective outsourcing of non-core services, ensuring maximum conversion to EBITDA.

Anchor Market Data

Market Positioning

Nusa Penida is one of Baliโ€™s fastest-growing destinations, with increasing demand for high-end, design-driven accommodations.

Comparable Properties
โ‚ฌ110 Avg. ADR
Domo Resort (Projected)
โ‚ฌ310 Target ADR

Domo Resort is positioned in the upper segment, leveraging architecture, location, and exclusivity to achieve ADR levels significantly above market average.

Capital Appreciation

Returns & Exit Strategy

The project targets a stabilized EBITDA margin of approximately 40โ€“45%, generating consistent annual cash flow. Investors benefit from:

  • Annual profit distributions starting from Year 2
  • Strong capital appreciation through asset value growth
  • Tax-optimized holding structure tailored for international partners
Primary Exit Approach Exit is projected in Year 5 through sale to a hospitality operator or institutional buyer at a projected 9-10% Cap Rate.
Risk Management

Risk & Mitigation

The project adopts a conservative financial approach with realistic occupancy and pricing assumptions.

Low Density

Reducing operational complexity and staff overhead.

Strong Brand

Architectural identity supporting premium ADR.

Diversified Rev

Accommodation, F&B, and Wellness revenue streams.

Active GP

Direct sponsor involvement in development & control.

Disclaimer: This material is for informational purposes only and does not constitute an offer or solicitation to invest. Details are provided upon request for qualified partners.

Capital Allocation (CAPEX)

Detailed budget breakdown by category

This chart represents the strategic distribution of the โ‚ฌ2.100.000 total investment. Architecture, land rights, and construction phases are prioritized to ensure asset longevity and premium positioning.

Detailed Budget

Category Investment Item Amount
Land Acquisition Land Purchase โ‚ฌ800.000
Construction Eco-Suite Structures โ‚ฌ1.100.000
Others Risk Buffer โ‚ฌ200.000
ESTIMATED TOTAL CAPITAL โ‚ฌ2.100.000

Operational Cost Structure (OPEX)
STAFF & PERSONNEL
โ‚ฌ50.400
17.4% of Rev
SERVICE STAFF
โ‚ฌ85.000
29.4% of Rev

Dynamic Investment Modeling

Market Intelligence & Scenario Studio

Unit Profitability Analysis (2026)
Values per individual unit/villa
GROSS REVENUE โ‚ฌ35.588
EST. OPEX & FEES 47%
NET PROFIT/UNIT โ‚ฌ18.861
๐Ÿ‚ Seasonality Index
High Season Duration 5 Months
Low Season Impact -25% Sales
โš™๏ธ Asset Operatives
32%
15%
โ‚ฌ2,200

These figures represent institutional benchmarks for the location and asset class. Scenario Mode shifts these variables to simulate risk.

INSTITUTIONAL GRADE ANALYSIS

10-Year Financial Forecast

ESTIMATED EXIT VALUE (Base Case - Year 5)

โ‚ฌ1.862.494

Cumulative Cash Flow i
Annual EBITDA i
Target Revenue i
My Estimated Payout i
PROJECTED IRR
--
Forecast Internal Return
EQUITY MULTIPLE
--
Projected Capital Growth
PAYBACK PERIOD
--
Target Capital Recovery
STABILIZED EBITDA
--
Est. Year 5 Net Profit
Note: Estimated values based on projected financial scenario.
Cumulative Revenue

Total gross income generated over the project lifecycle.

ฮฃ (ADR ร— Occ ร— Units ร— 365)
Cumulative Cash Flow

Net capital remaining after all costs and investment recovery.

ฮฃ(Rev - Opex - Tax) - Inv
Annual EBITDA

Performance operative excluding non-cash items and taxes.

Revenue - OPEX
Investor Return

Net profit share attributable to your specific investment.

(CashFlow ร— My Inv) / Total
Break-even reached in Year 11.78

Full capital recovery achieved before stabilization phase. This model illustrates a balanced risk-return profile, with strong cash flow generation and clear capital recovery timeline.

10-Year EBITDA & Revenue Projection

Values in Euro (โ‚ฌ)

Cash Flow Analysis

Target Yield 52.60%
Equity Multiple 2.20

Annual Net Cash Flow Table

Year Estimated Occupancy Gross Revenue Operational Profit (EBITDA) Net Cash Flow
Year 1 45% โ‚ฌ1.017.529 โ‚ฌ356.135 โ‚ฌ292.031
Year 2 60% โ‚ฌ1.397.406 โ‚ฌ558.962 โ‚ฌ458.349
Year 3 85% โ‚ฌ2.037.319 โ‚ฌ916.793 โ‚ฌ751.771
Year 4 87% โ‚ฌ2.144.272 โ‚ฌ1.029.251 โ‚ฌ843.986
Year 5 85% โ‚ฌ2.152.639 โ‚ฌ1.076.319 โ‚ฌ882.582
Year 6 85% โ‚ฌ2.210.299 โ‚ฌ1.105.149 โ‚ฌ906.222
Year 7 85% โ‚ฌ2.267.959 โ‚ฌ1.133.979 โ‚ฌ929.863
Year 8 85% โ‚ฌ2.325.618 โ‚ฌ1.162.809 โ‚ฌ953.504
Year 9 85% โ‚ฌ2.383.278 โ‚ฌ1.191.639 โ‚ฌ977.144
Year 10 85% โ‚ฌ2.440.938 โ‚ฌ1.220.469 โ‚ฌ1.000.785
ADR Growth

+3.50% Annual

OPEX Growth

+2.50% Annual

Break-even Occupancy

5.8% Target

Anรกlisis de Sensibilidad al Riesgo

Matriz de Sensibilidad (Anรกlisis IRR)

Base Case: โ‚ฌ250 @ 75%
ADR \ OCC 65% 70% 75% 80% 85%
โ‚ฌ200 94.7% 101.6% 108.5% 115.5% 122.4%
โ‚ฌ225 105.9% 113.7% 121.5% 129.3% 137.1%
โ‚ฌ250 117.2% 125.9% 134.5% 143.2% 151.9%
โ‚ฌ275 128.5% 138.0% 147.5% 157.1% 166.6%
โ‚ฌ300 139.7% 150.1% 160.5% 170.9% 181.3%

Legal Disclaimer: This sensitivity analysis is based on historical market performance and projected operational standards in Nusa Penida. Actual results may vary depending on global tourism trends, local regulations, and macroeconomic factors. This is not a guarantee of future returns.

Restricted Access

Investor Documentation

Institutional Prospectus

Download the full technical and financial overview of the project.

Download Technical PDF
Elite Network

Private Deal Room

Exclusively available to authorized investors.

Register to Access
Asset Discussion
Live
ANTONIO RUTILIO Final architectural refinements on the Master Villa are now complete.
PARTNER Excellent. Reviewing the updated ROI pro-forma now.
Conectividad Geogrรกfica

Logรญstica y Trayectoria del Inversor

View on Google Maps Global Access Analysis
Roadmap Legend
Air Connection
Road / Highway
Sea Way (Ferry)
Connectivity Guide 2 STEPS
Airport Arrival
Air
15 min
Kintamani High-Road
Road
2h 15min (72 km)
Total Travel ~ โ‚ฌ45
Infrastructure Active
Lifestyle & Exploration

Local Attractions & POIs

Surroundings Analysis
Highlight Destinations

No POIs added yet. Add them in the admin "Points of Interest" tab.

Local Gems

Discover the best spots within minutes of your doorstep.

Geographic Connectivity

Logistics & Connectivity Hub

Coords: -8.243546, 115.36789
Proximity Benchmarks
Nearest Intl Airport Analysis Pending
Coastline / Beach Direct Access
Nearest Harbor / Port Analyzing Hub
Road Infrastructure Paved Access
Medical Center Local Clinic nearby
Education Hubs N/A
Infrastructure Status
Connectivity Standard mobile
Grid Reliability Stable (Public Grid)
Supply Chain Regional Logistics
Strategic Overlay

Analyzing local development trends and infrastructure roadmap...