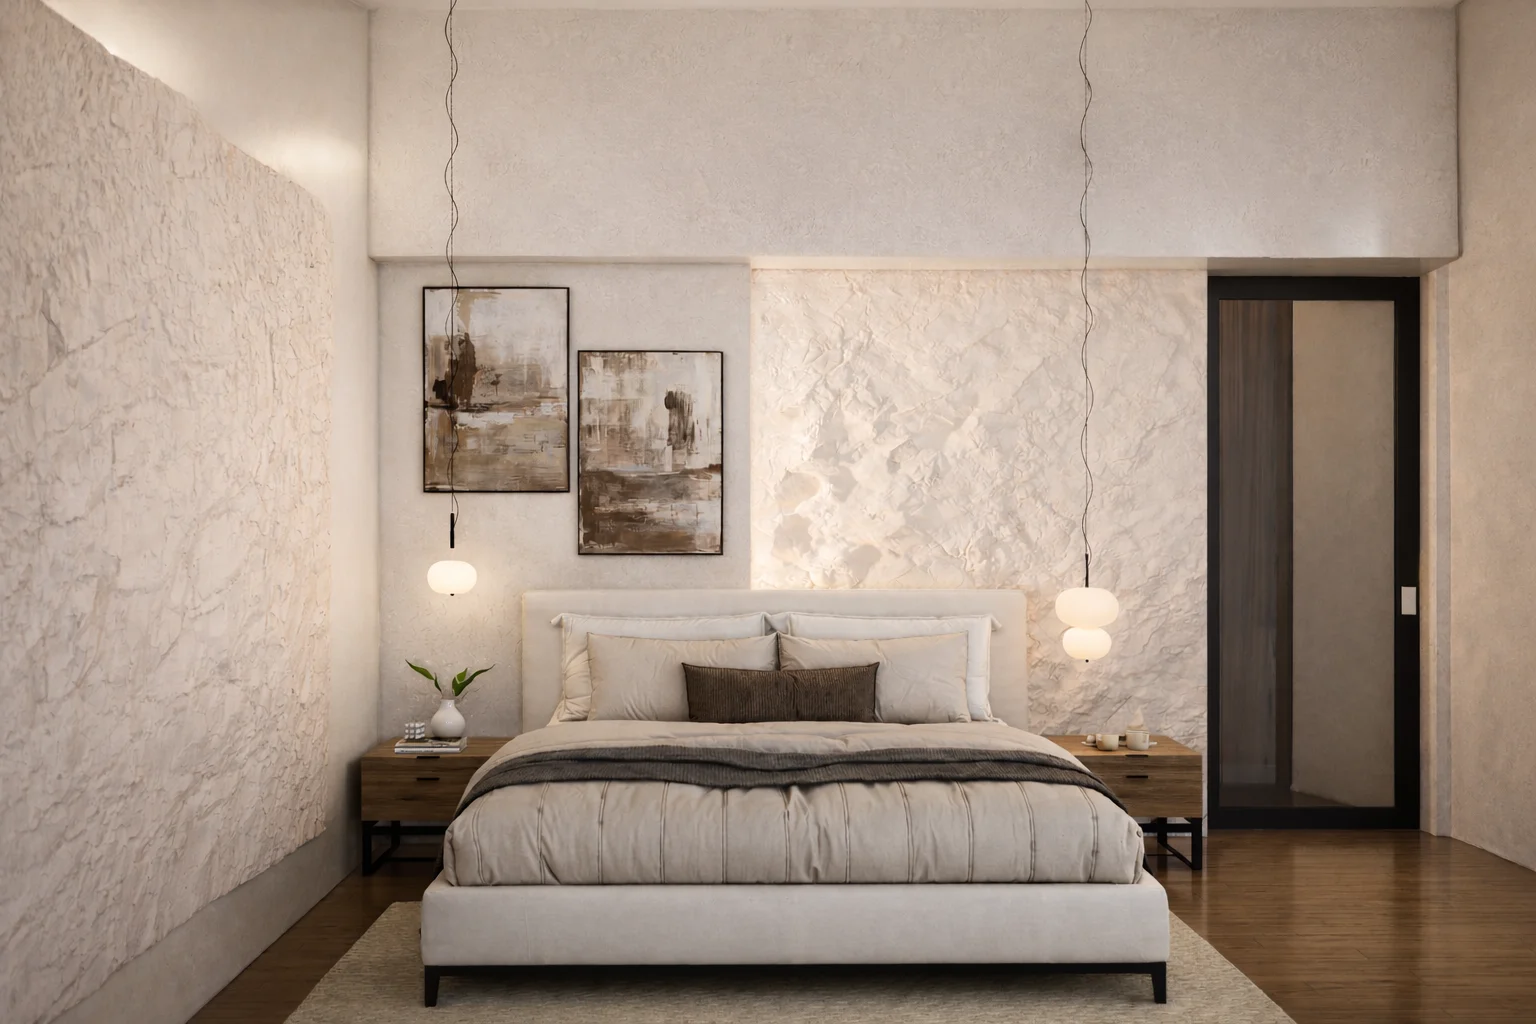
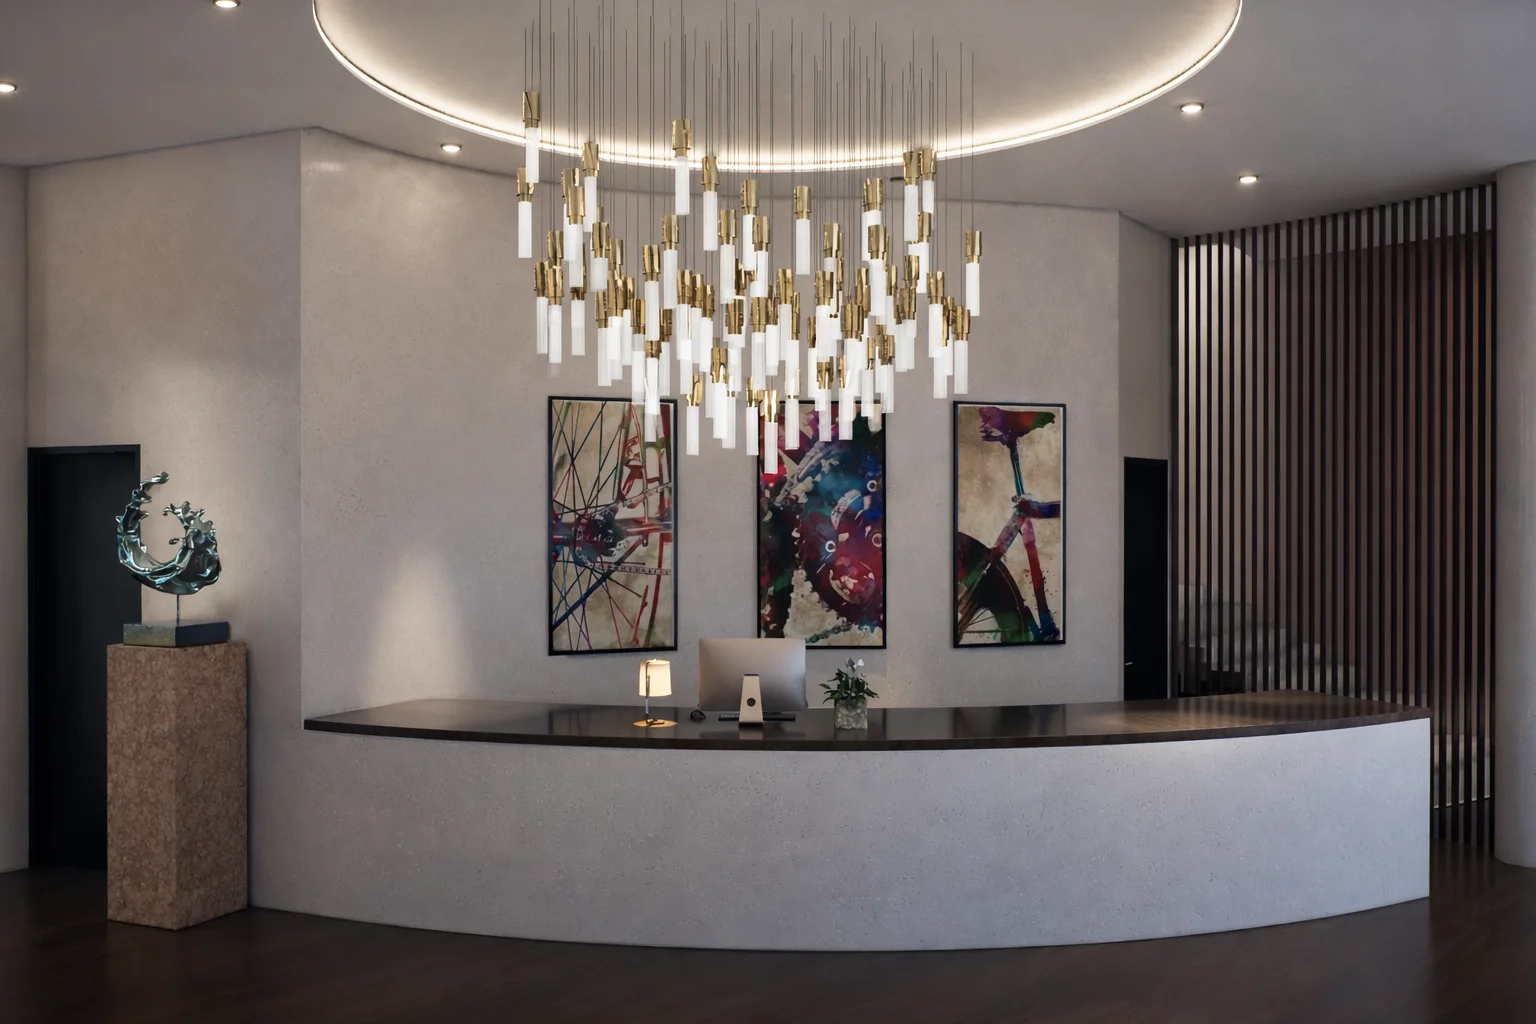
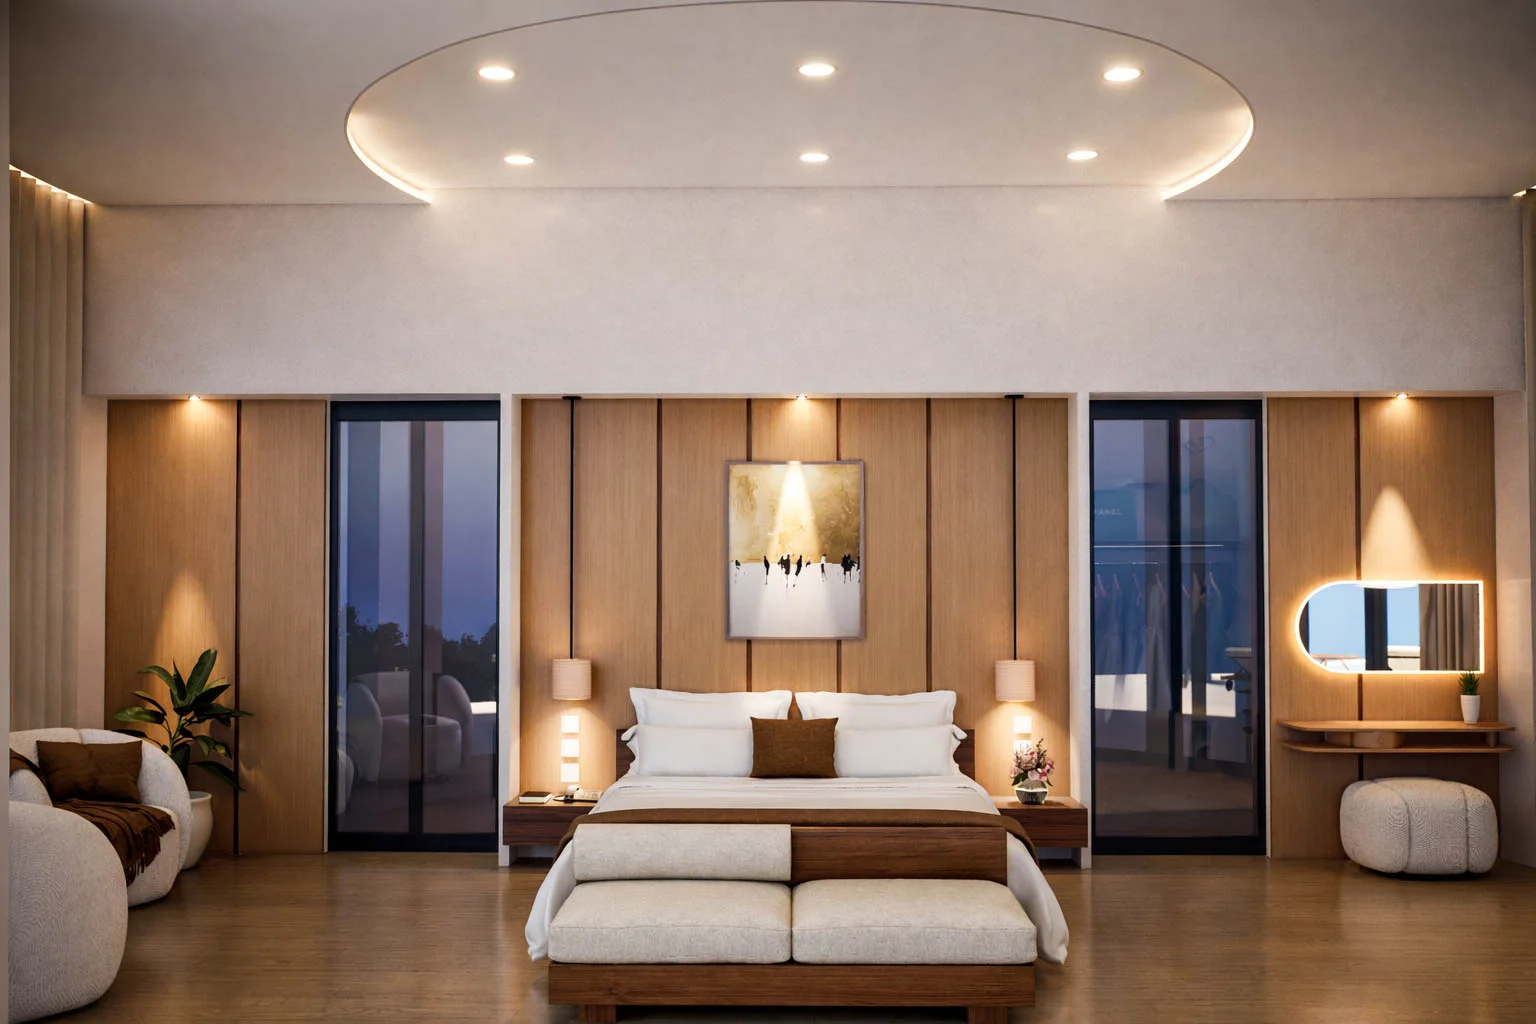
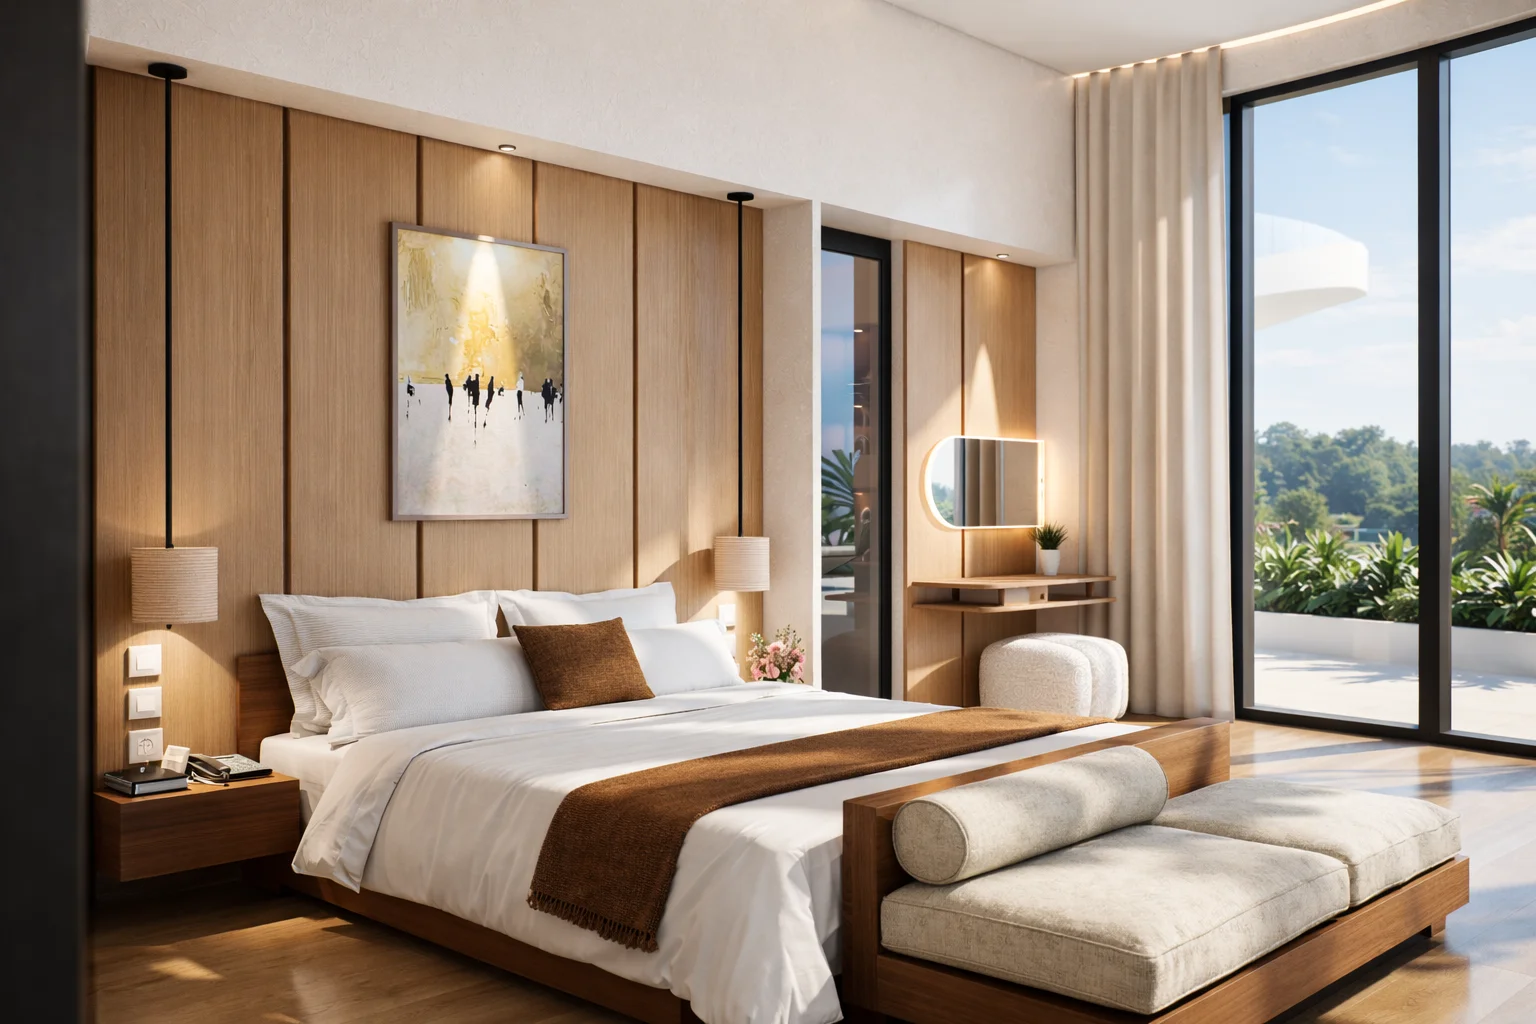
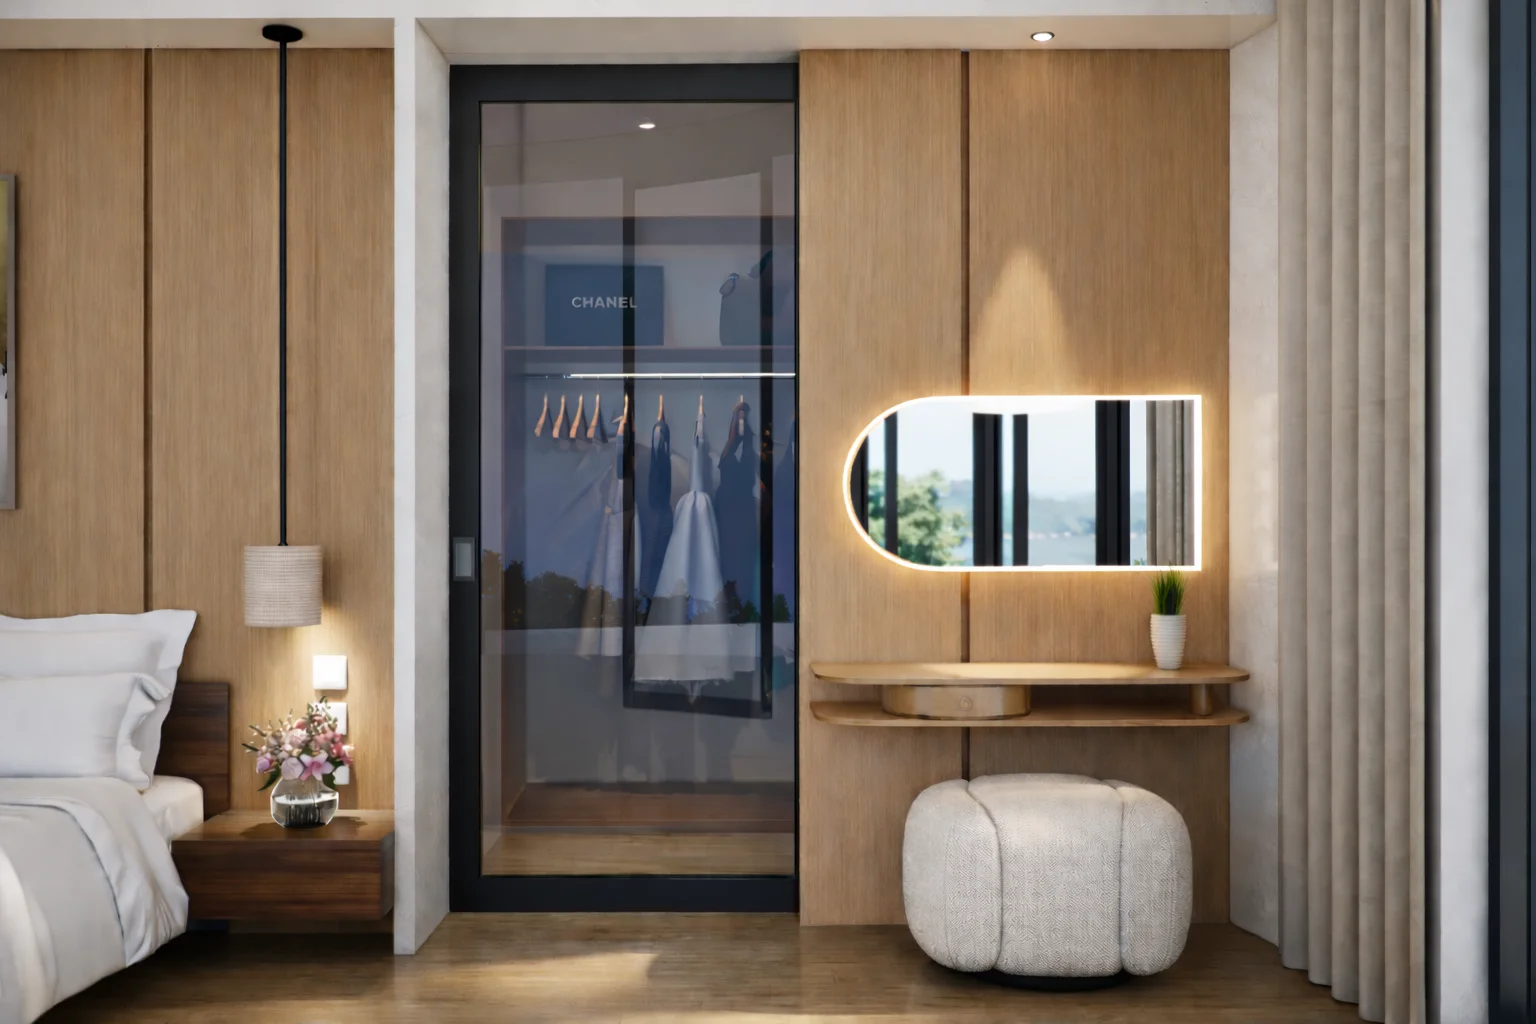
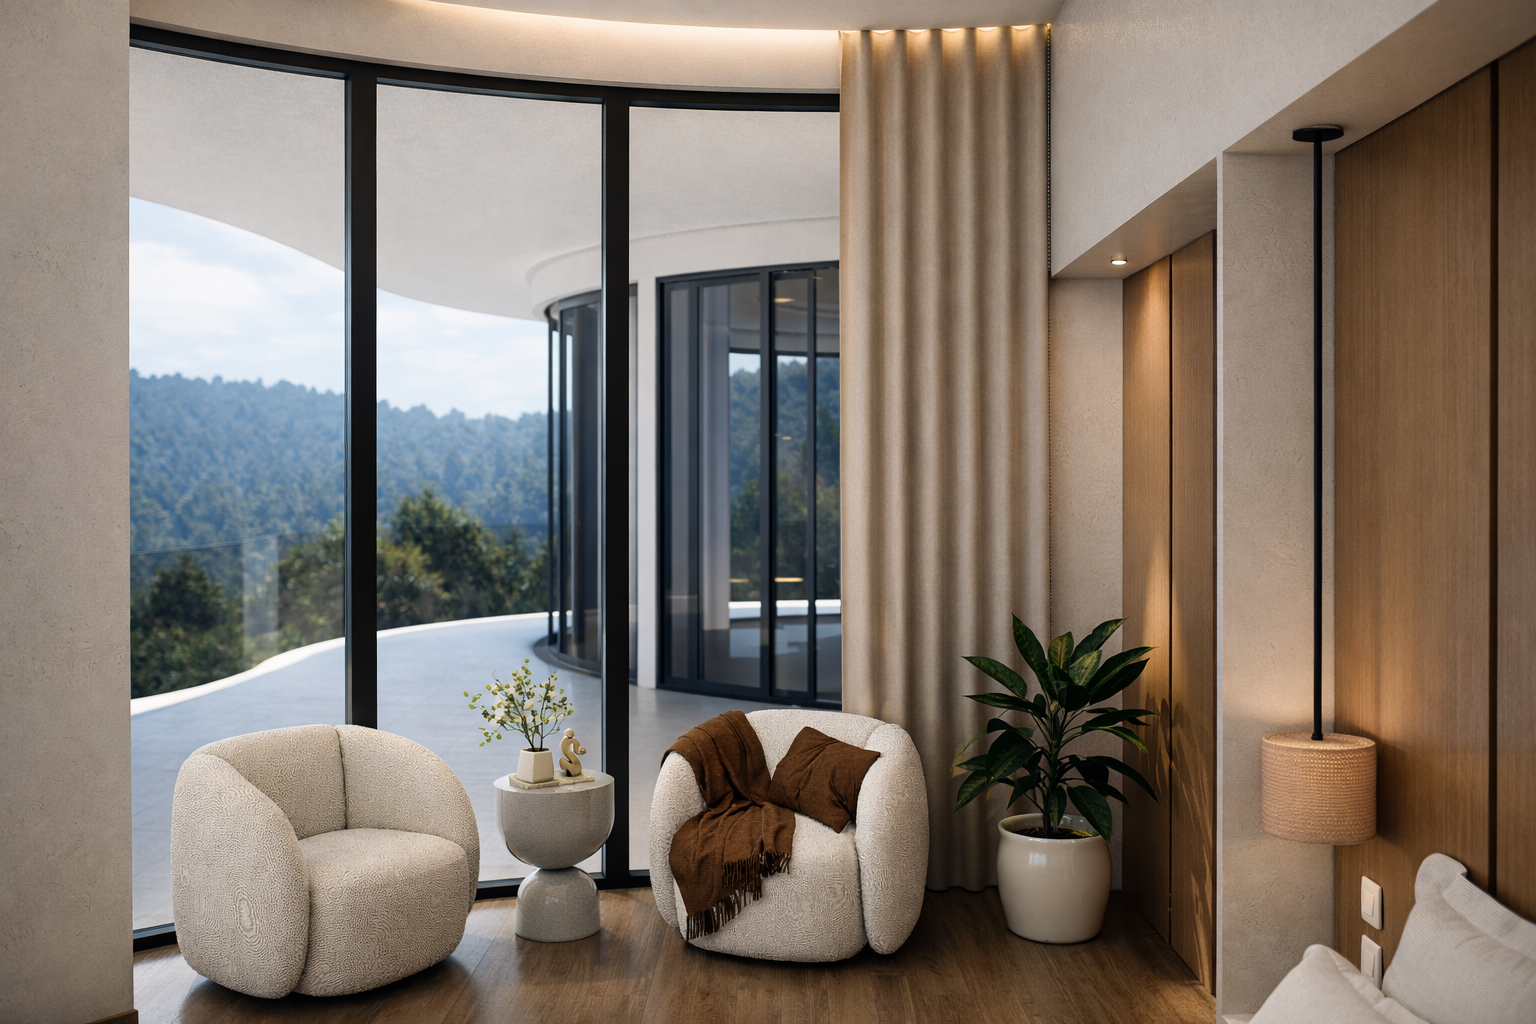
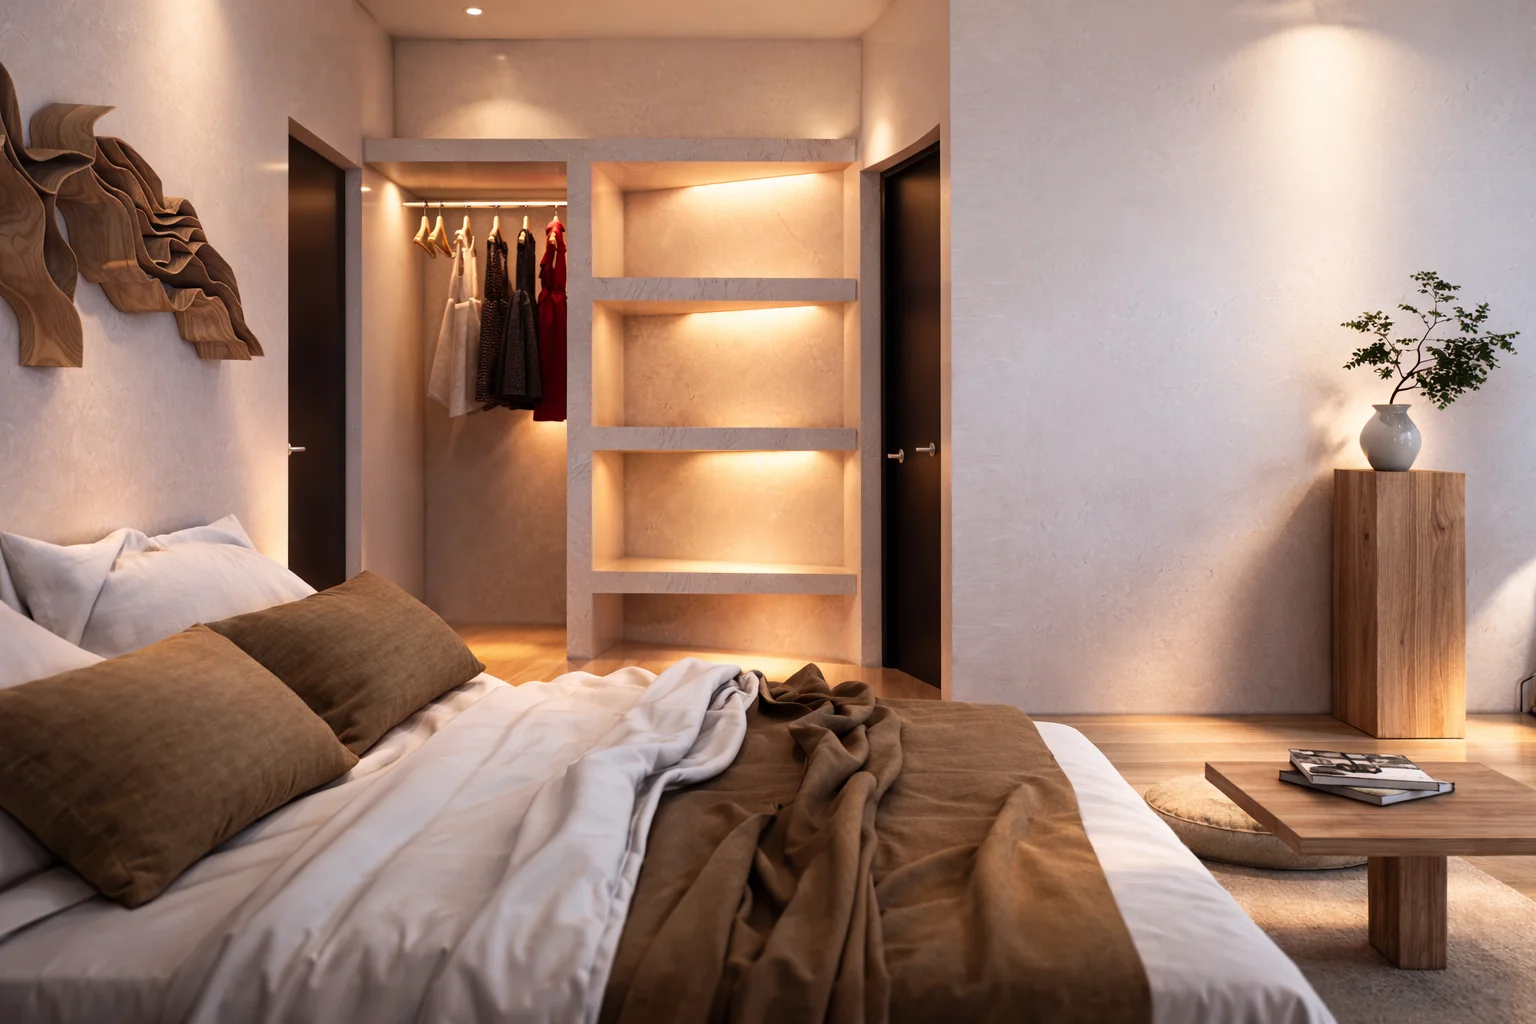
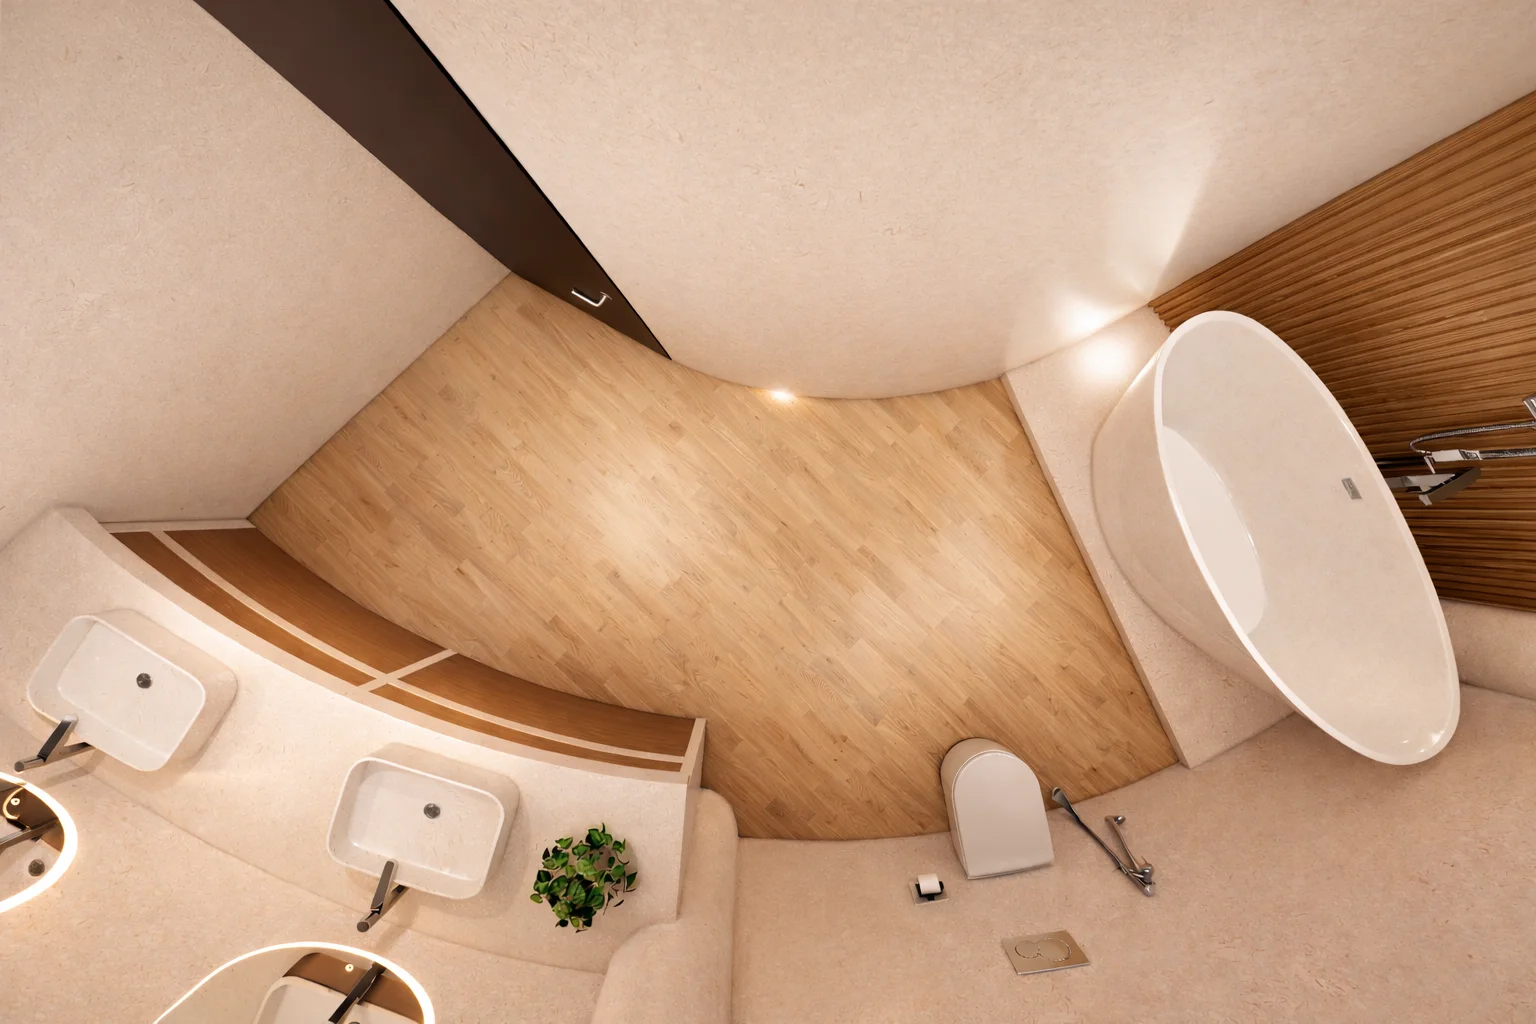
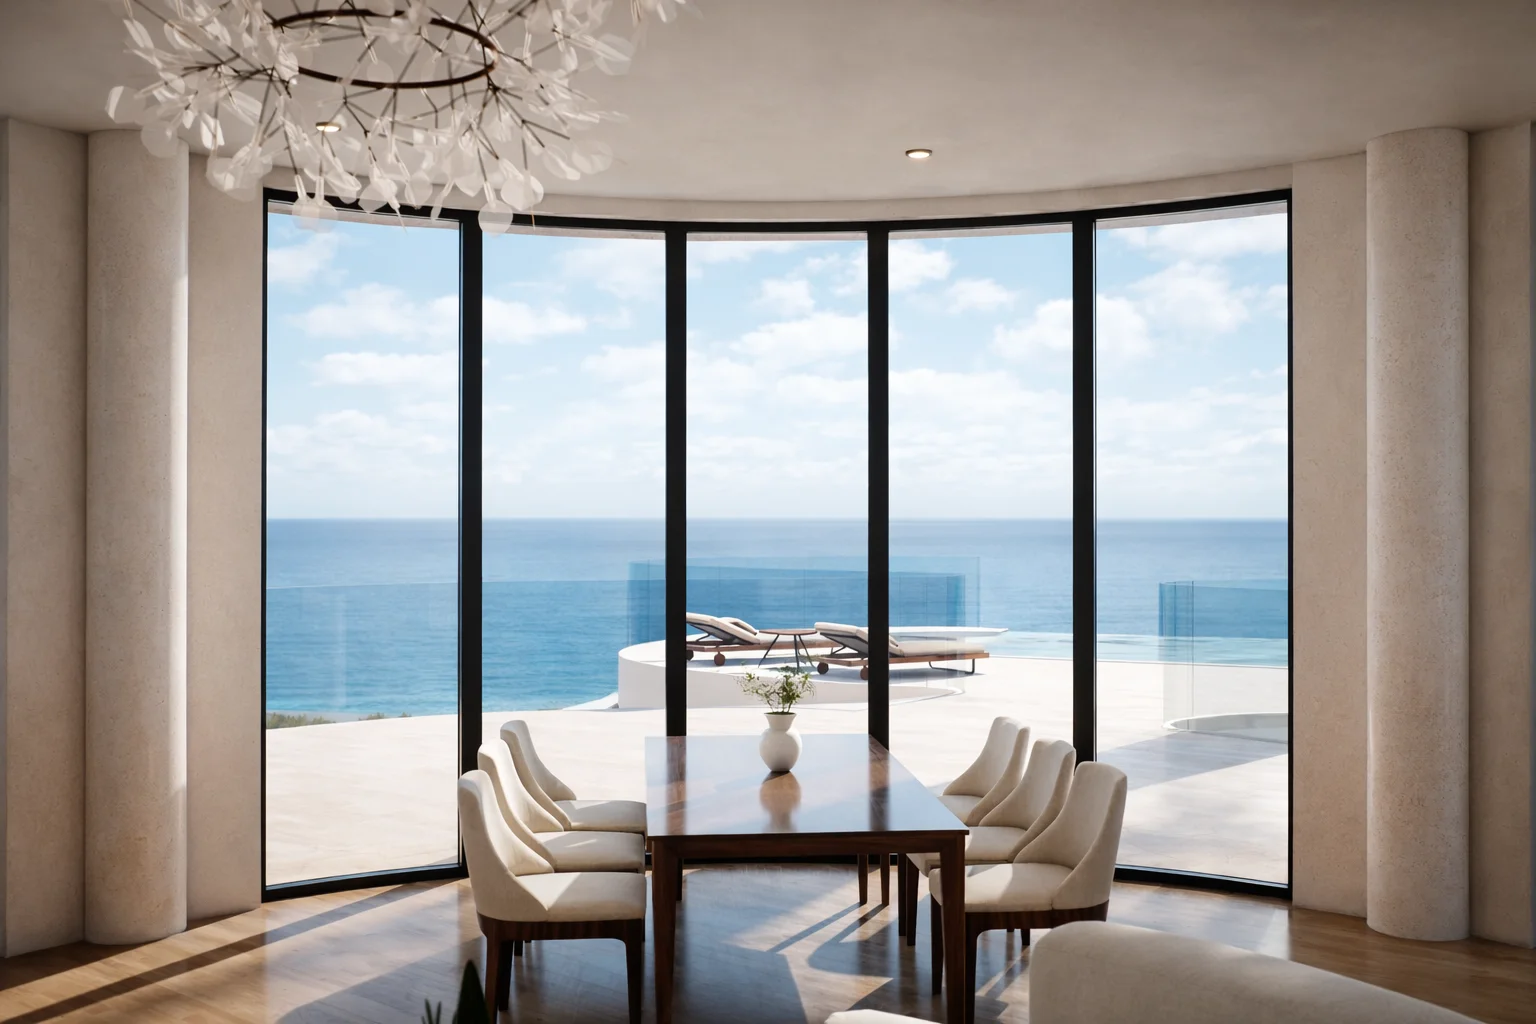
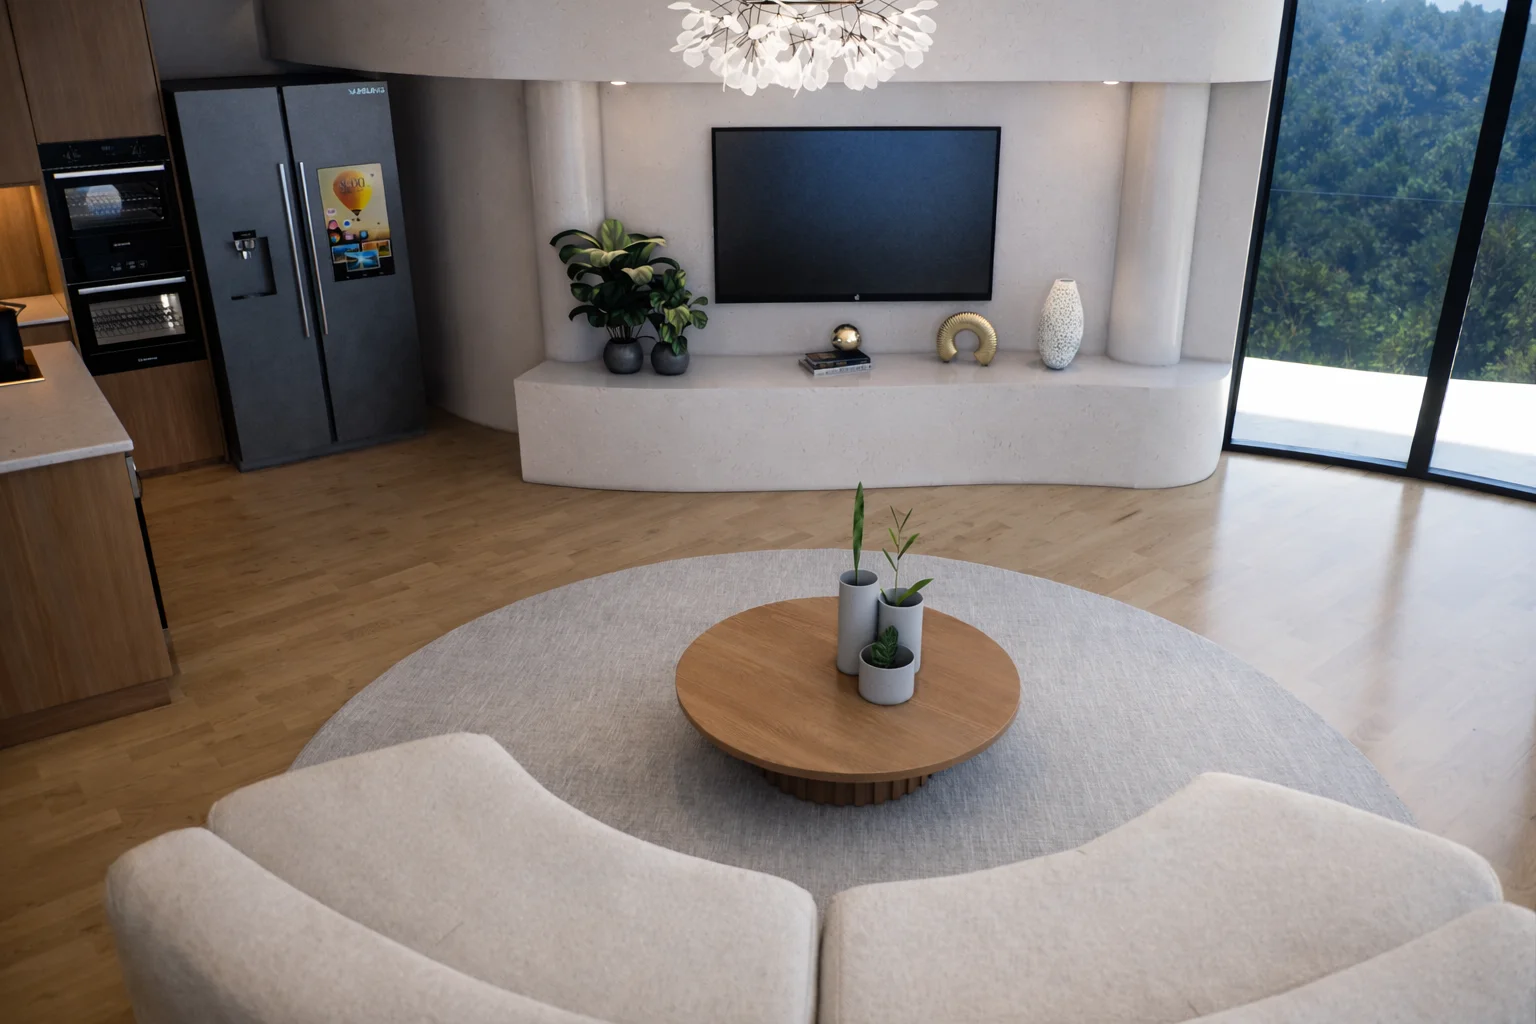
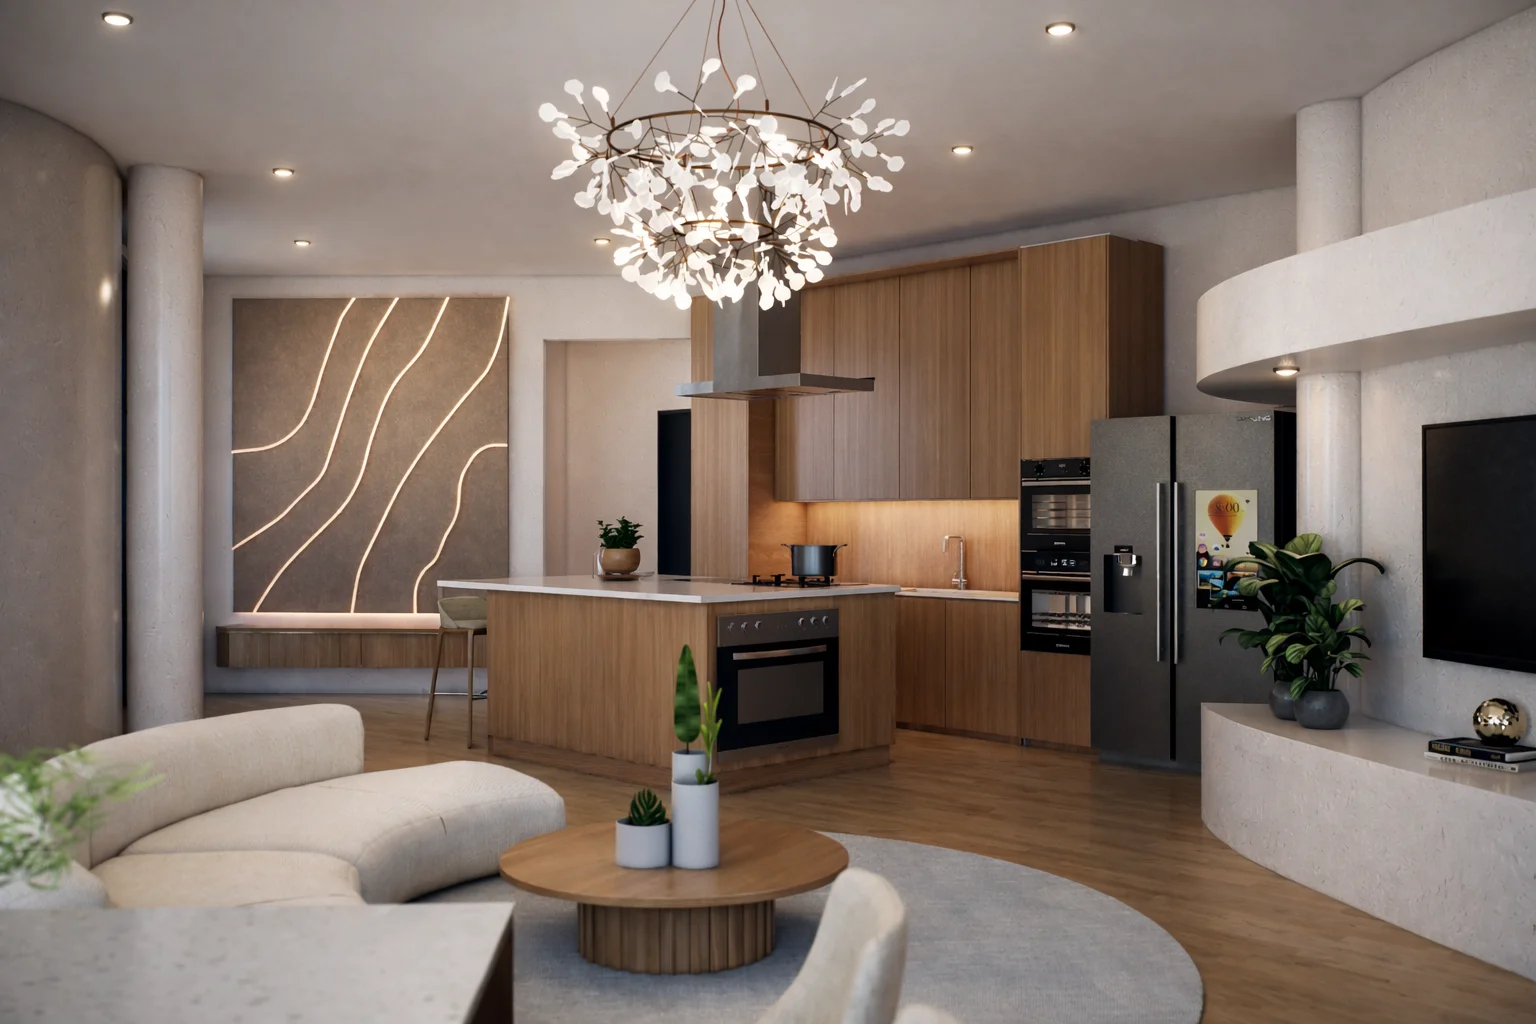
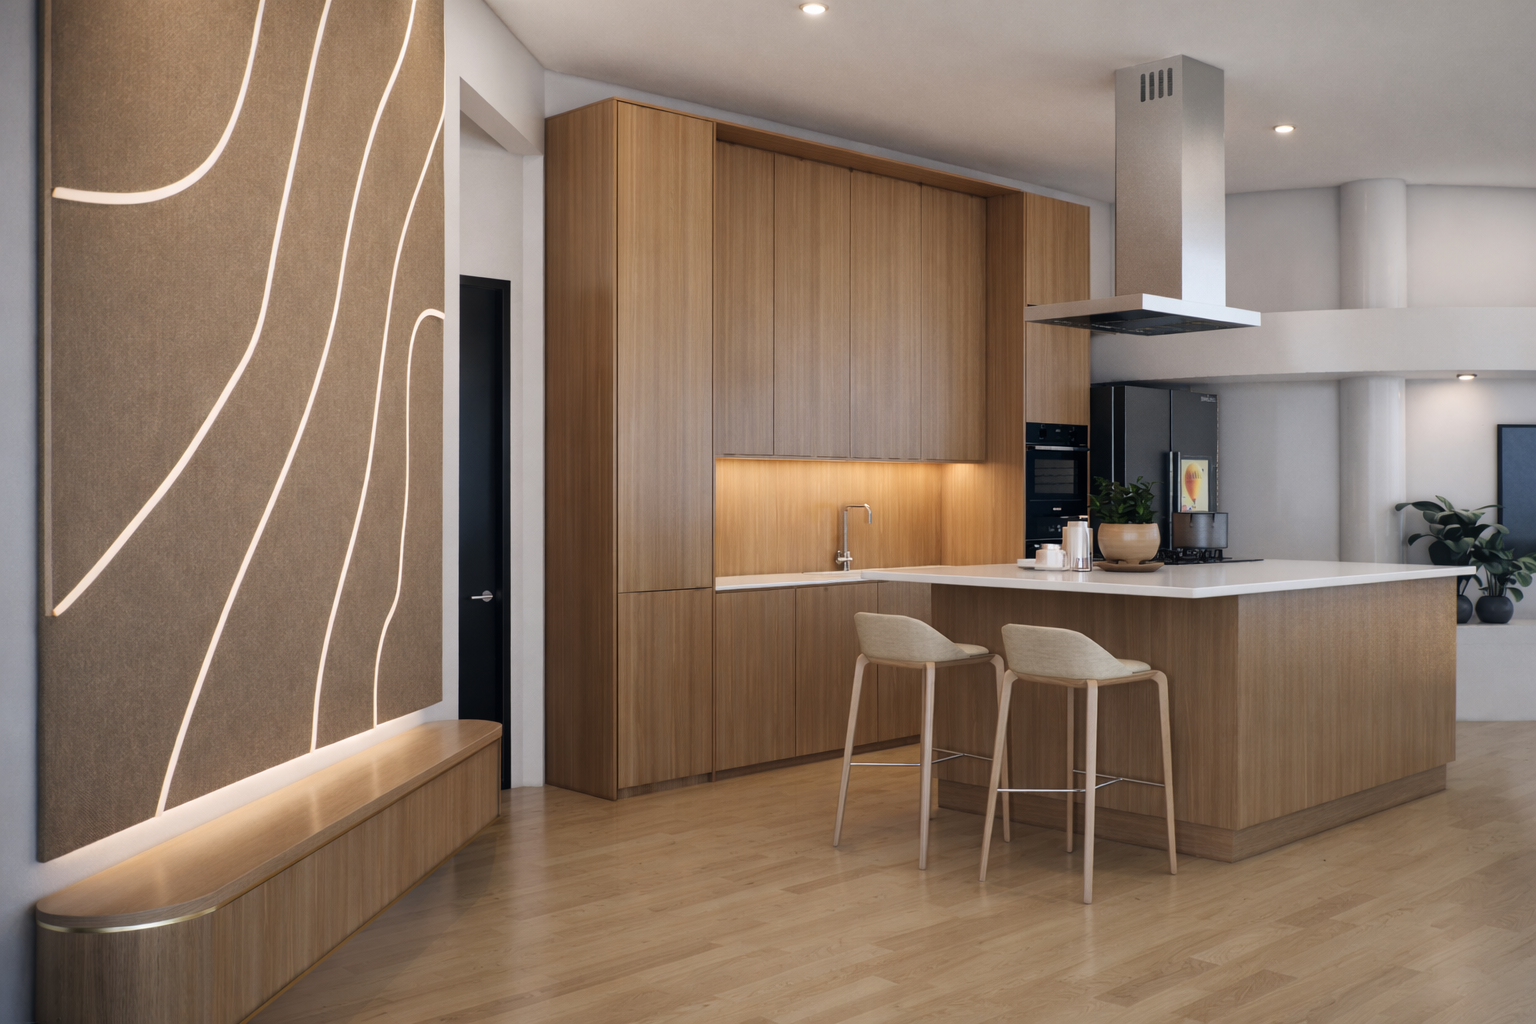
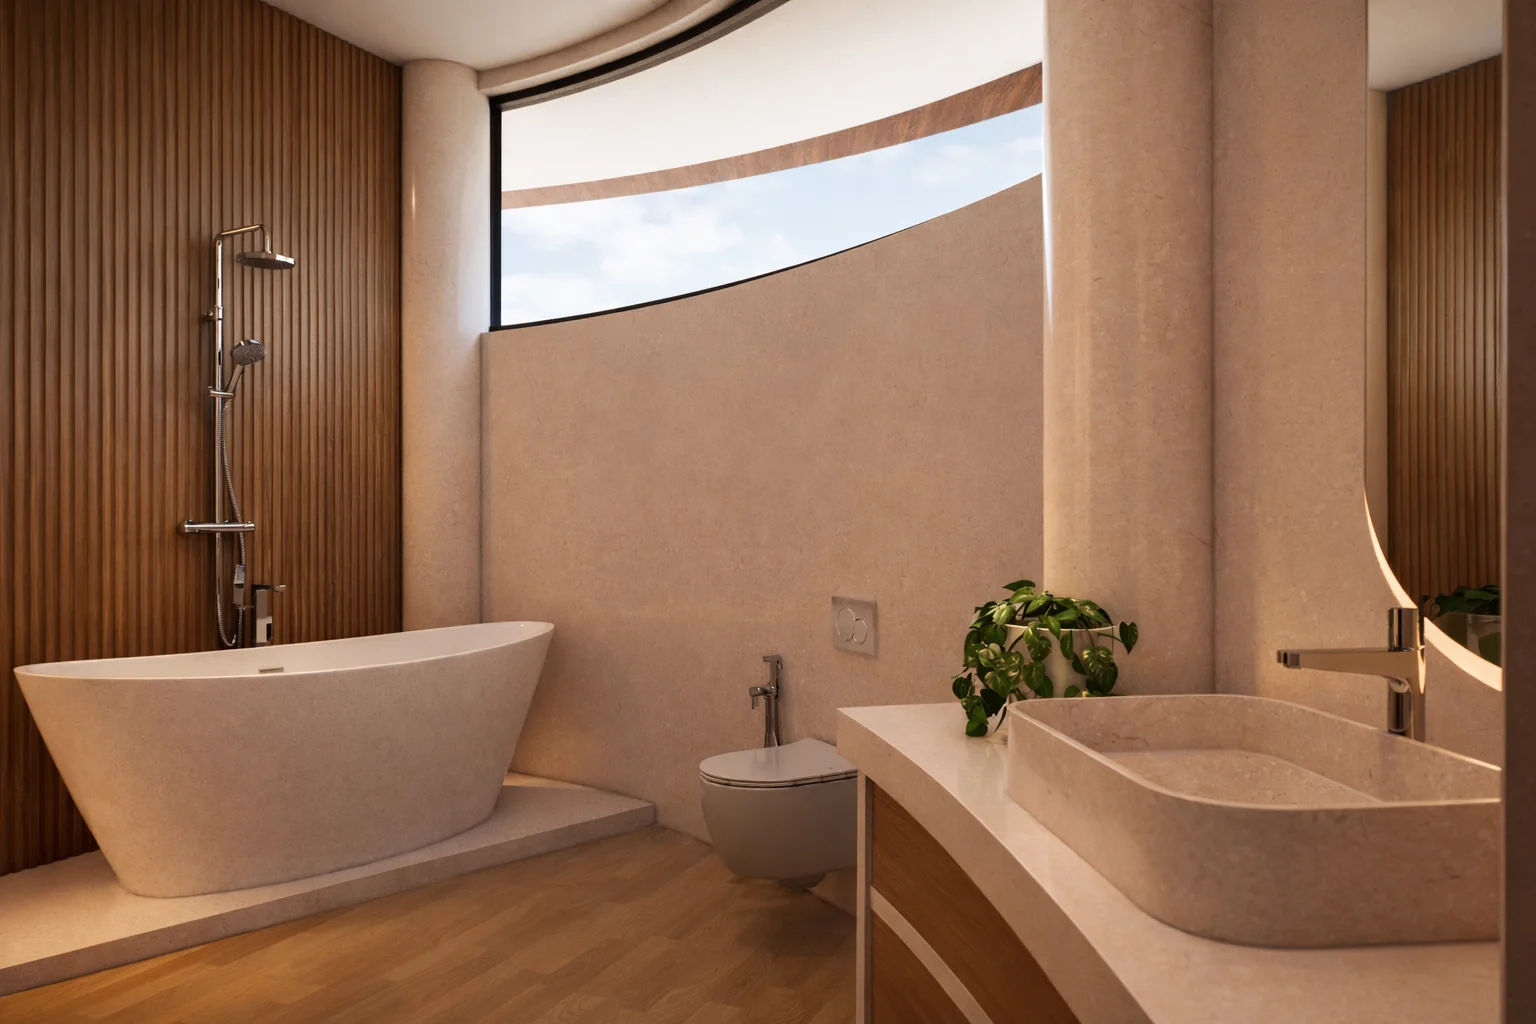
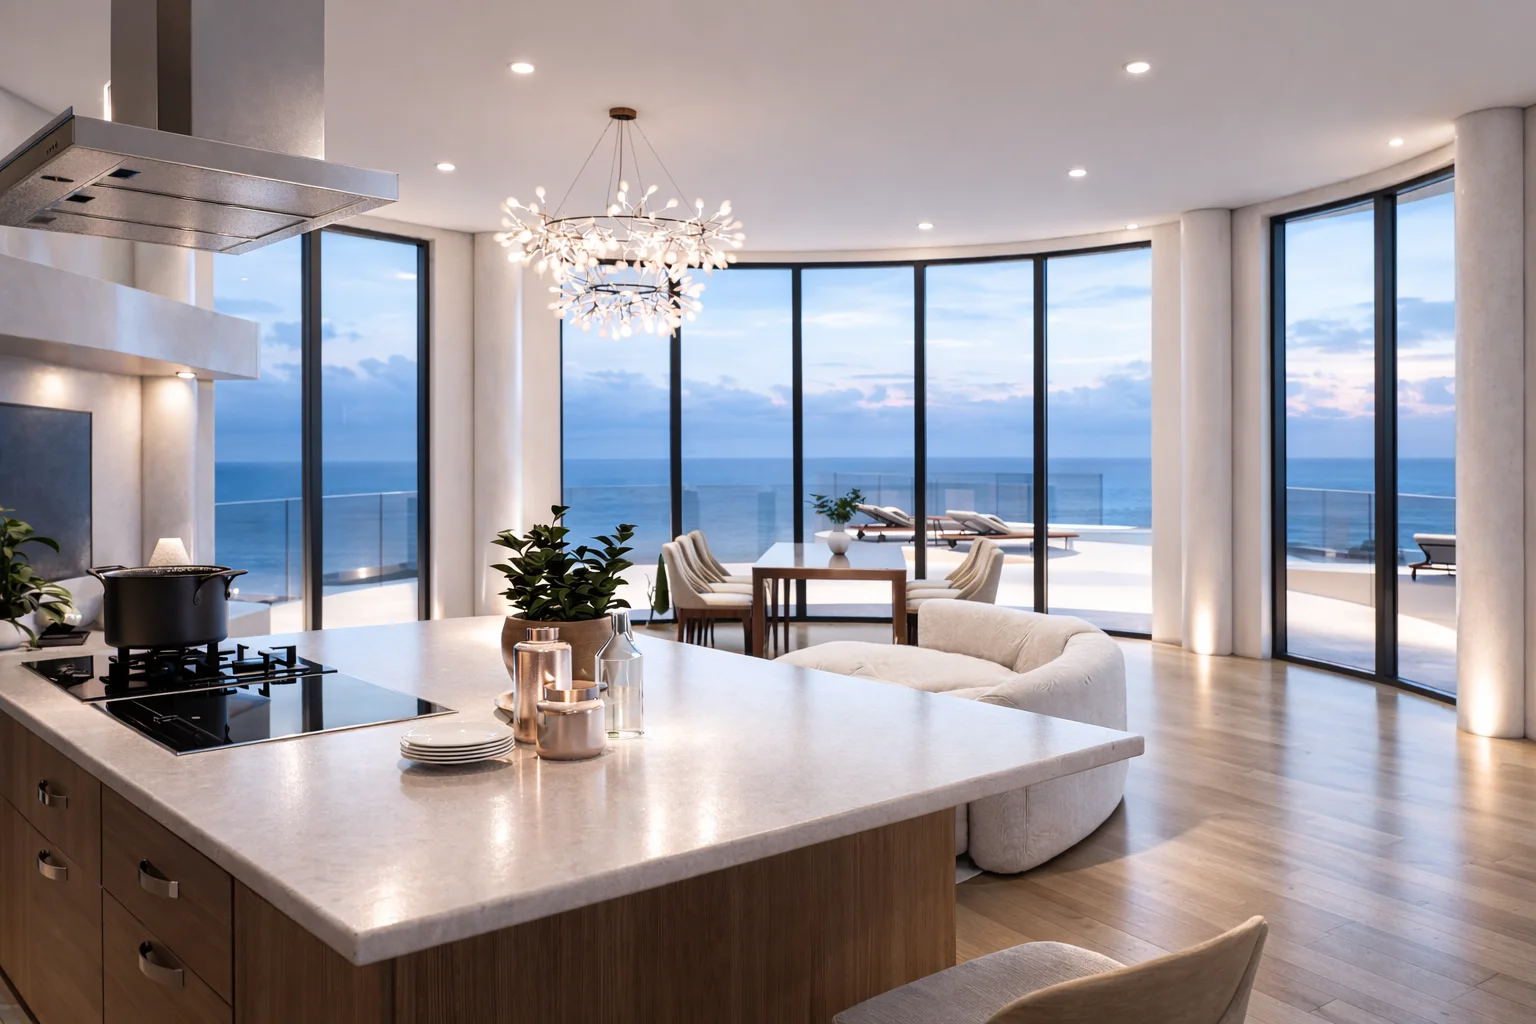
Il progetto Nusa Penida Cliffside incarna l'eccellenza dell'eco-turismo di lusso. Situato su un lotto di 2400 mq con affaccio diretto sull'oceano, il resort fonde un'architettura sostenibile d'avanguardia con servizi di ospitalità d'alto profilo. Ognuna delle 16 suite è concepita come un rifugio privato, dotata di piscina esclusiva, interior design su misura e una fluida continuità tra spazi interni ed esterni.
Un prestigioso boutique resort a picco sul mare sulla leggendaria isola di Nusa Penida, con 8 ville ultra-lusso dal design d'eccellenza e vista infinita sull'oceano.
€3,680k
€50k
22.70%
Freehold
Discover the mix of premium villas and suites driving the resort revenue, with average daily rates (ADR) scaled by exclusivity.
Rather than a simple average, the resort average daily rate (ADR) of €411.25 is calculated dynamically using a weighted average based on inventory mix. This yields highly precise, risk-adjusted yield pro-formas.
In luxury boutique operations, rooms drive only a portion of total yield. Pro-formas integrate additional revenue streams calculated as ratios of room revenues:
Nusa Penida: il nuovo epicentro del lusso ecosostenibile a Bali, protagonista di una crescita record nella domanda di viaggi d'élite e architettura di prestigio.


| Metric | Value |
|---|---|
| Land Cost | €0 (est.) |
| Construction Cost | €0 (est.) |
| Development Cost | €0 (est.) |
| Projected Exit Value | €0 (est.) |
| ROI | 22.70% |
| Timeline | 18 Months |
Analisi strategica basata su dati di mercato reali: transizione dal turismo di un giorno a soggiorni di lusso prolungati.
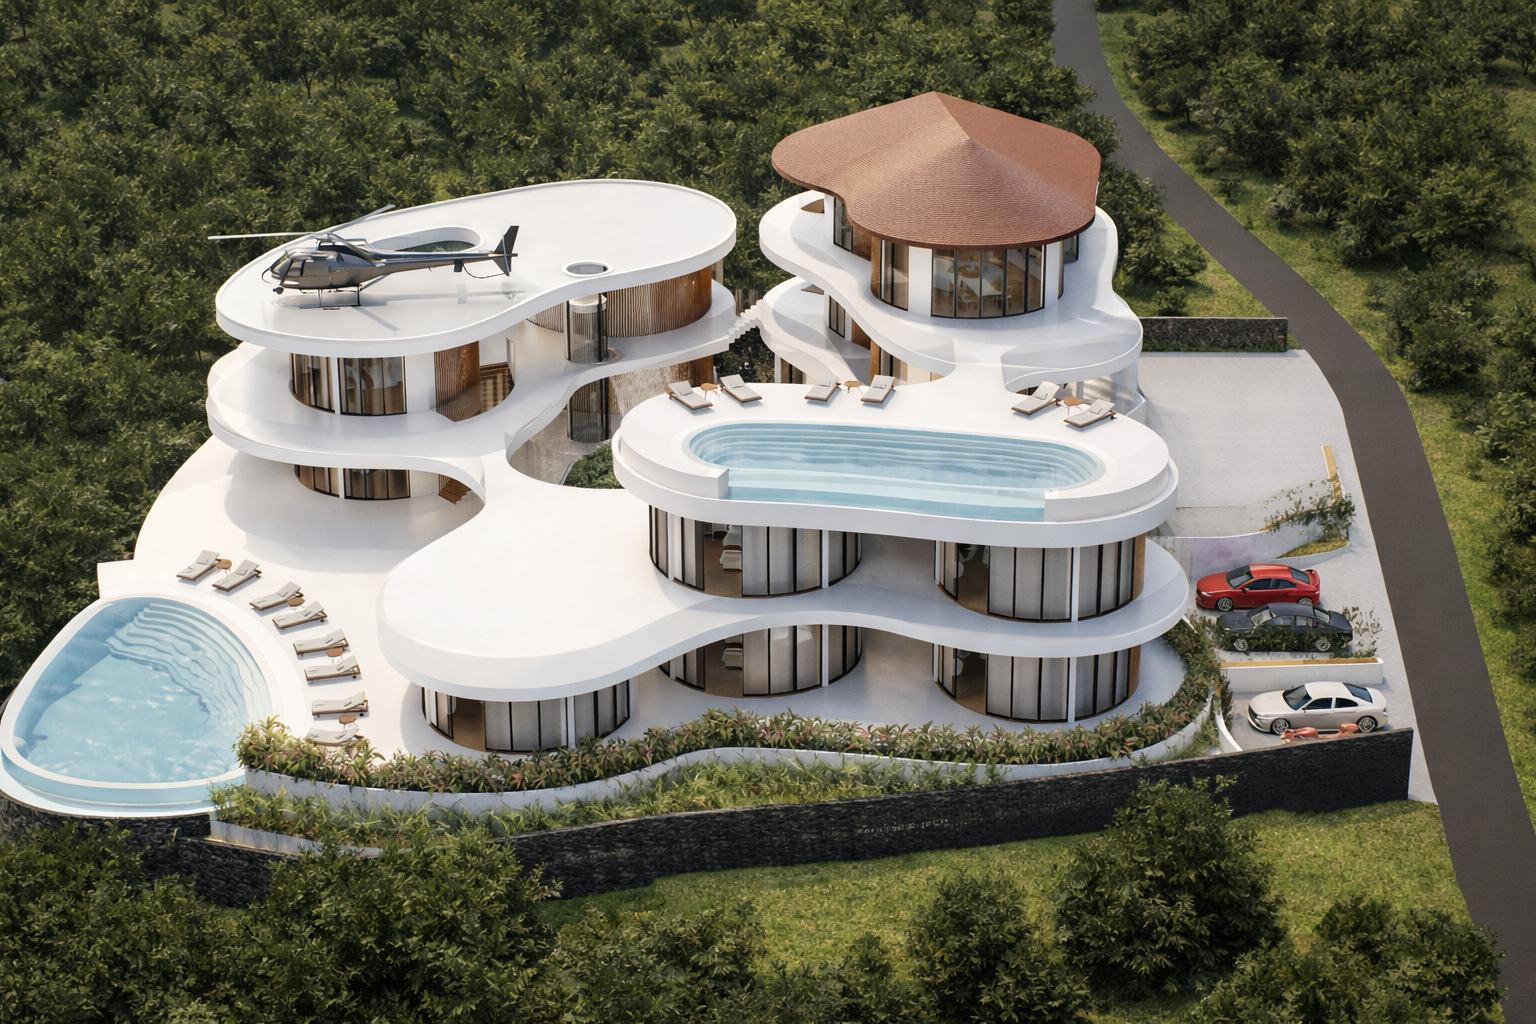
Il progetto è posizionato nel segmento alto delle offerte di ospitalità di Nusa Penida, sfruttando una posizione unica sulla scogliera che garantisce privacy e viste spettacolari. L'architettura "Domo" non è solo estetica, ma una scelta strategica per garantire un ADR (Tariffa Media Giornaliera) superiore alla media di mercato.
Adottiamo un modello di gestione snello che riduce i costi fissi e massimizza il margine EBITDA. La bassa densità del resort consente un rapporto ottimale tra personale e ospiti, garantendo un servizio d'élite senza i gravosi costi fissi dei grandi complessi alberghieri.
Nusa Penida è cresciuta da 200.000 arrivi nel 2017 a oltre 1,1 milioni nel 2024. Il cambiamento critico è il passaggio dai viaggiatori "mordi e fuggi" a soggiorni di lusso prolungati. Gli investitori istituzionali e il crescente segmento del "viaggio lento" cercano spazi esclusivi e a bassa densità. Posizionandoci in una posizione privilegiata sulla scogliera, catturiamo la fase di maturità iniziale del boom del lusso dell'isola, anticipando un apprezzamento del capitale più elevato rispetto ai mercati saturi come Canggu.
Simulate your returns by adjusting the investment amount below.
27.1%
€1.9M
44.0%
5 Years
Year 7
€4.0M
€27.100
Based on IRR 27.1%The project is designed as a low-density, high-margin boutique resort, optimizing both pricing and operational efficiency. Revenue is driven by premium positioning, ocean-view units, and strong demand for experiential hospitality in Nusa Penida.
Operating costs are controlled through a lean operational model and selective outsourcing of non-core services, ensuring maximum conversion to EBITDA.
>Nusa Penida is one of Bali’s fastest-growing destinations, with increasing demand for high-end, design-driven accommodations.
L'ADR stimato di €550 (media ponderata) per Nusa Penida Cliffside è ampiamente giustificato dall'unicità della sua posizione a strapiombo sul mare e dall'iconico design a tre piani firmato Antonio Rutilio Architecture & Design. Il resort si posiziona nettamente al di sopra della media del mercato locale (ADR €350) grazie all'esclusività di sole 16 unità con piscina privata, capaci di attrarre una clientela internazionale alto-spendente e di garantire un tasso di occupazione stabilizzato del 75%.
The project targets a stabilized EBITDA margin of approximately 40–45%, generating consistent annual cash flow. Investors benefit from:
The project adopts a conservative financial approach with realistic occupancy and pricing assumptions.
Reducing operational complexity and staff overhead.
Architectural identity supporting premium ADR.
Accommodation, F&B, and Wellness revenue streams.
Direct sponsor involvement in development & control.
Disclaimer: This material is for informational purposes only and does not constitute an offer or solicitation to invest. Details are provided upon request for qualified partners.
This chart represents the strategic distribution of the €3.680.000 total investment. Architecture, land rights, and construction phases are prioritized to ensure asset longevity and premium positioning.
| Category | Investment Item | Amount |
|---|---|---|
| Land Acquisition | Freehold Acquisition | €720.000 |
| Construction | Main Structure & Roof | €1.500.000 |
| Furniture & Interiors | Elite FF&E Package | €450.000 |
| Other | Safety Reserve | €290.000 |
| Design & Architecture | Architectural & Technical Design | €300.000 |
| Furniture & Interiors | Lighting & decoration | €80.000 |
| Furniture & Interiors | Equipment (AC, system) | €120.000 |
| Project Management | Project management | €70.000 |
| Design & Architecture | Engineering consultant | €50.000 |
| Permits & Legal | Building permits & licenses | €60.000 |
| Permits & Legal | Legal & company setup | €15.000 |
| Other | Staff training & hiring | €25.000 |
| ESTIMATED TOTAL CAPITAL | €3.680.000 | |
These figures represent institutional benchmarks for the location and asset class. Scenario Mode shifts these variables to simulate risk.
Total gross income generated over the project lifecycle.
Net capital remaining after all costs and investment recovery.
Performance operative excluding non-cash items and taxes.
Net profit share attributable to your specific investment.
Full capital recovery achieved before stabilization phase. This model illustrates a balanced risk-return profile, with strong cash flow generation and clear capital recovery timeline.
| Year | Estimated Occupancy | Gross Revenue | Operational Profit (EBITDA) | Net Cash Flow |
|---|---|---|---|---|
| Year 1 | 55% | €1.212.028 | €387.849 | €318.036 |
| Year 2 | 65% | €1.475.369 | €531.133 | €435.529 |
| Year 3 | 75% | €1.751.932 | €700.773 | €574.634 |
| Year 4 | 77% | €1.849.555 | €776.813 | €636.987 |
| Year 5 | 75% | €1.851.097 | €814.483 | €667.876 |
| Year 6 | 75% | €1.900.680 | €836.299 | €685.766 |
| Year 7 | 75% | €1.950.263 | €858.116 | €703.655 |
| Year 8 | 75% | €1.999.846 | €879.932 | €721.545 |
| Year 9 | 75% | €2.049.429 | €901.749 | €739.434 |
| Year 10 | 75% | €2.099.012 | €923.565 | €757.324 |
| Year 11 | 75% | €2.161.983 | €951.272 | €780.043 |
| Year 12 | 75% | €2.226.842 | €979.811 | €803.445 |
| Year 13 | 75% | €2.293.647 | €1.009.205 | €827.548 |
| Year 14 | 75% | €2.362.457 | €1.039.481 | €852.374 |
| Year 15 | 75% | €2.433.331 | €1.070.665 | €877.946 |
| Year 16 | 75% | €2.506.331 | €1.102.785 | €904.284 |
| Year 17 | 75% | €2.581.520 | €1.135.869 | €931.413 |
| Year 18 | 75% | €2.658.966 | €1.169.945 | €959.355 |
| Year 19 | 75% | €2.738.735 | €1.205.043 | €988.136 |
| Year 20 | 75% | €2.820.897 | €1.241.195 | €1.017.780 |
| Year 21 | 75% | €2.905.524 | €1.278.431 | €1.048.313 |
| Year 22 | 75% | €2.992.690 | €1.316.783 | €1.079.762 |
| Year 23 | 75% | €3.082.470 | €1.356.287 | €1.112.155 |
| Year 24 | 75% | €3.174.945 | €1.396.976 | €1.145.520 |
| Year 25 | 75% | €3.270.193 | €1.438.885 | €1.179.886 |
| Year 26 | 75% | €3.368.299 | €1.482.051 | €1.215.282 |
| Year 27 | 75% | €3.469.348 | €1.526.513 | €1.251.741 |
| Year 28 | 75% | €3.573.428 | €1.572.308 | €1.289.293 |
| Year 29 | 75% | €3.680.631 | €1.619.478 | €1.327.972 |
| Year 30 | 75% | €3.791.050 | €1.668.062 | €1.367.811 |
| Year 31 | 75% | €3.904.781 | €1.718.104 | €1.408.845 |
| Year 32 | 75% | €4.021.925 | €1.769.647 | €1.451.110 |
| Year 33 | 75% | €4.142.582 | €1.822.736 | €1.494.644 |
| Year 34 | 75% | €4.266.860 | €1.877.418 | €1.539.483 |
| Year 35 | 75% | €4.394.866 | €1.933.741 | €1.585.668 |
| Year 36 | 75% | €4.526.712 | €1.991.753 | €1.633.238 |
| Year 37 | 75% | €4.662.513 | €2.051.506 | €1.682.235 |
| Year 38 | 75% | €4.802.388 | €2.113.051 | €1.732.702 |
| Year 39 | 75% | €4.946.460 | €2.176.442 | €1.784.683 |
| Year 40 | 75% | €5.094.854 | €2.241.736 | €1.838.223 |
| Year 41 | 75% | €5.247.700 | €2.308.988 | €1.893.370 |
| Year 42 | 75% | €5.405.130 | €2.378.257 | €1.950.171 |
| Year 43 | 75% | €5.567.284 | €2.449.605 | €2.008.676 |
| Year 44 | 75% | €5.734.303 | €2.523.093 | €2.068.936 |
| Year 45 | 75% | €5.906.332 | €2.598.786 | €2.131.005 |
| Year 46 | 75% | €6.083.522 | €2.676.750 | €2.194.935 |
| Year 47 | 75% | €6.266.028 | €2.757.052 | €2.260.783 |
| Year 48 | 75% | €6.454.008 | €2.839.764 | €2.328.606 |
| Year 49 | 75% | €6.647.629 | €2.924.957 | €2.398.464 |
| Year 50 | 75% | €6.847.058 | €3.012.705 | €2.470.418 |
| Year 51 | 75% | €7.052.469 | €3.103.087 | €2.544.531 |
| Year 52 | 75% | €7.264.043 | €3.196.179 | €2.620.867 |
| Year 53 | 75% | €7.481.965 | €3.292.064 | €2.699.493 |
| Year 54 | 75% | €7.706.424 | €3.390.826 | €2.780.478 |
| Year 55 | 75% | €7.937.616 | €3.492.551 | €2.863.892 |
| Year 56 | 75% | €8.175.745 | €3.597.328 | €2.949.809 |
| Year 57 | 75% | €8.421.017 | €3.705.248 | €3.038.303 |
| Year 58 | 75% | €8.673.648 | €3.816.405 | €3.129.452 |
| Year 59 | 75% | €8.933.857 | €3.930.897 | €3.223.336 |
| Year 60 | 75% | €9.201.873 | €4.048.824 | €3.320.036 |
| Year 61 | 75% | €9.477.929 | €4.170.289 | €3.419.637 |
| Year 62 | 75% | €9.762.267 | €4.295.397 | €3.522.226 |
| Year 63 | 75% | €10.055.135 | €4.424.259 | €3.627.893 |
| Year 64 | 75% | €10.356.789 | €4.556.987 | €3.736.729 |
| Year 65 | 75% | €10.667.493 | €4.693.697 | €3.848.831 |
| Year 66 | 75% | €10.987.517 | €4.834.508 | €3.964.296 |
| Year 67 | 75% | €11.317.143 | €4.979.543 | €4.083.225 |
| Year 68 | 75% | €11.656.657 | €5.128.929 | €4.205.722 |
| Year 69 | 75% | €12.006.357 | €5.282.797 | €4.331.894 |
| Year 70 | 75% | €12.366.548 | €5.441.281 | €4.461.850 |
| Year 71 | 75% | €12.737.544 | €5.604.519 | €4.595.706 |
| Year 72 | 75% | €13.119.670 | €5.772.655 | €4.733.577 |
| Year 73 | 75% | €13.513.261 | €5.945.835 | €4.875.584 |
| Year 74 | 75% | €13.918.658 | €6.124.210 | €5.021.852 |
| Year 75 | 75% | €14.336.218 | €6.307.936 | €5.172.507 |
| Year 76 | 75% | €14.766.305 | €6.497.174 | €5.327.683 |
| Year 77 | 75% | €15.209.294 | €6.692.089 | €5.487.513 |
| Year 78 | 75% | €15.665.573 | €6.892.852 | €5.652.139 |
| Year 79 | 75% | €16.135.540 | €7.099.637 | €5.821.703 |
| Year 80 | 75% | €16.619.606 | €7.312.627 | €5.996.354 |
| Year 81 | 75% | €17.118.194 | €7.532.005 | €6.176.244 |
| Year 82 | 75% | €17.631.740 | €7.757.966 | €6.361.532 |
| Year 83 | 75% | €18.160.692 | €7.990.705 | €6.552.378 |
| Year 84 | 75% | €18.705.513 | €8.230.426 | €6.748.949 |
| Year 85 | 75% | €19.266.678 | €8.477.338 | €6.951.418 |
| Year 86 | 75% | €19.844.679 | €8.731.659 | €7.159.960 |
| Year 87 | 75% | €20.440.019 | €8.993.608 | €7.374.759 |
| Year 88 | 75% | €21.053.220 | €9.263.417 | €7.596.002 |
| Year 89 | 75% | €21.684.816 | €9.541.319 | €7.823.882 |
| Year 90 | 75% | €22.335.361 | €9.827.559 | €8.058.598 |
| Year 91 | 75% | €23.005.421 | €10.122.385 | €8.300.356 |
| Year 92 | 75% | €23.695.584 | €10.426.057 | €8.549.367 |
| Year 93 | 75% | €24.406.452 | €10.738.839 | €8.805.848 |
| Year 94 | 75% | €25.138.645 | €11.061.004 | €9.070.023 |
| Year 95 | 75% | €25.892.805 | €11.392.834 | €9.342.124 |
| Year 96 | 75% | €26.669.589 | €11.734.619 | €9.622.388 |
| Year 97 | 75% | €27.469.676 | €12.086.658 | €9.911.059 |
| Year 98 | 75% | €28.293.767 | €12.449.257 | €10.208.391 |
| Year 99 | 75% | €29.142.580 | €12.822.735 | €10.514.643 |
| Year 100 | 75% | €30.016.857 | €13.207.417 | €10.830.082 |
+3.50% Annual
+2.50% Annual
11.4% Target
| ADR \ OCC | 65% | 70% | 75% | 80% | 85% |
|---|---|---|---|---|---|
| €200 | 21.3% | 22.6% | 23.9% | 25.2% | 26.5% |
| €225 | 23.4% | 24.9% | 26.3% | 27.8% | 29.2% |
| €250 | 25.5% | 27.1% | 28.7% | 30.4% | 32.0% |
| €275 | 27.6% | 29.4% | 31.2% | 33.0% | 34.7% |
| €300 | 29.7% | 31.7% | 33.6% | 35.5% | 37.5% |
Legal Disclaimer: This sensitivity analysis is based on historical market performance and projected operational standards in Nusa Penida. Actual results may vary depending on global tourism trends, local regulations, and macroeconomic factors. This is not a guarantee of future returns.
Download the full technical and financial overview of the project.
Request Data Room (NDA Required)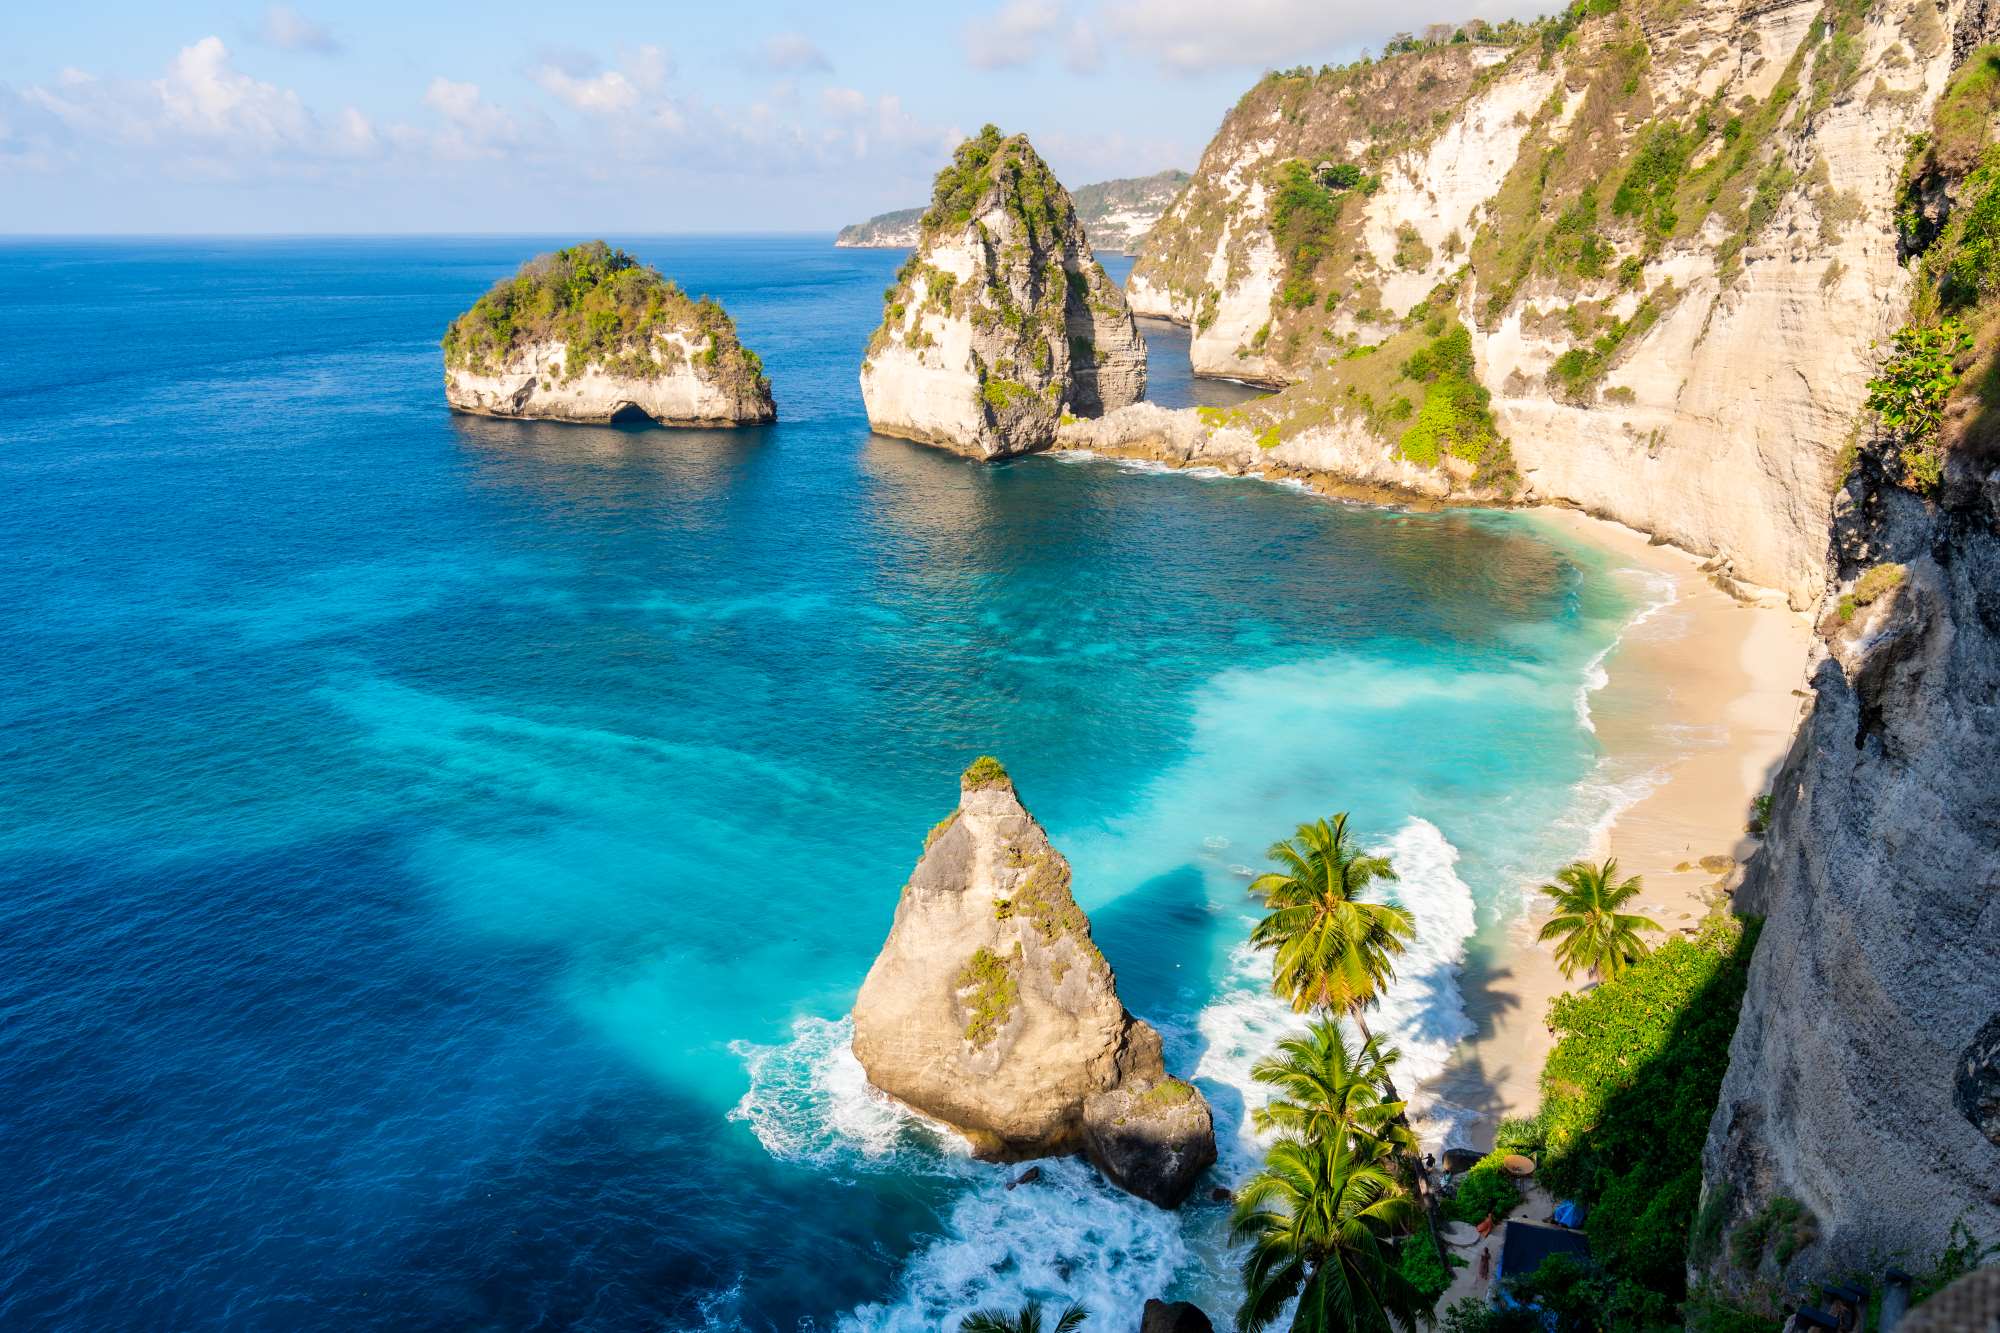
Incredibile spiaggia di sabbia bianca a picco sul mare sulla punta orientale di Nusa Penida.

La famosa scogliera a forma di T-Rex e la spiaggia di sabbia bianca incontaminata sottostante.
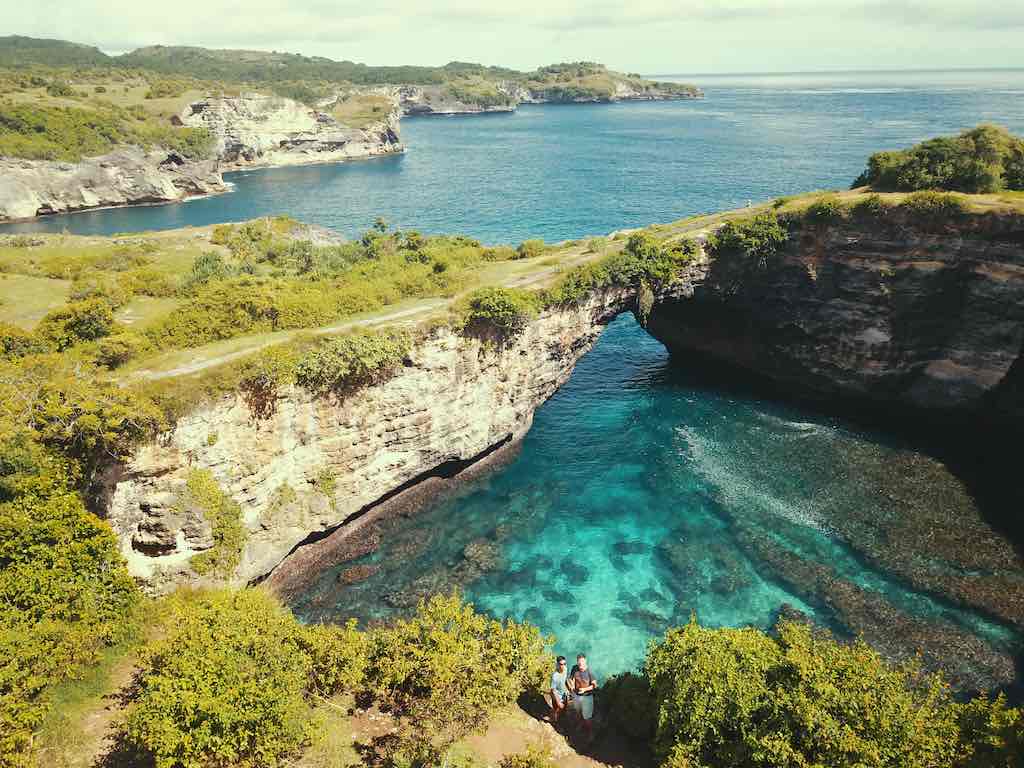
Un pittoresco arco naturale sopra una baia di mare turchese.
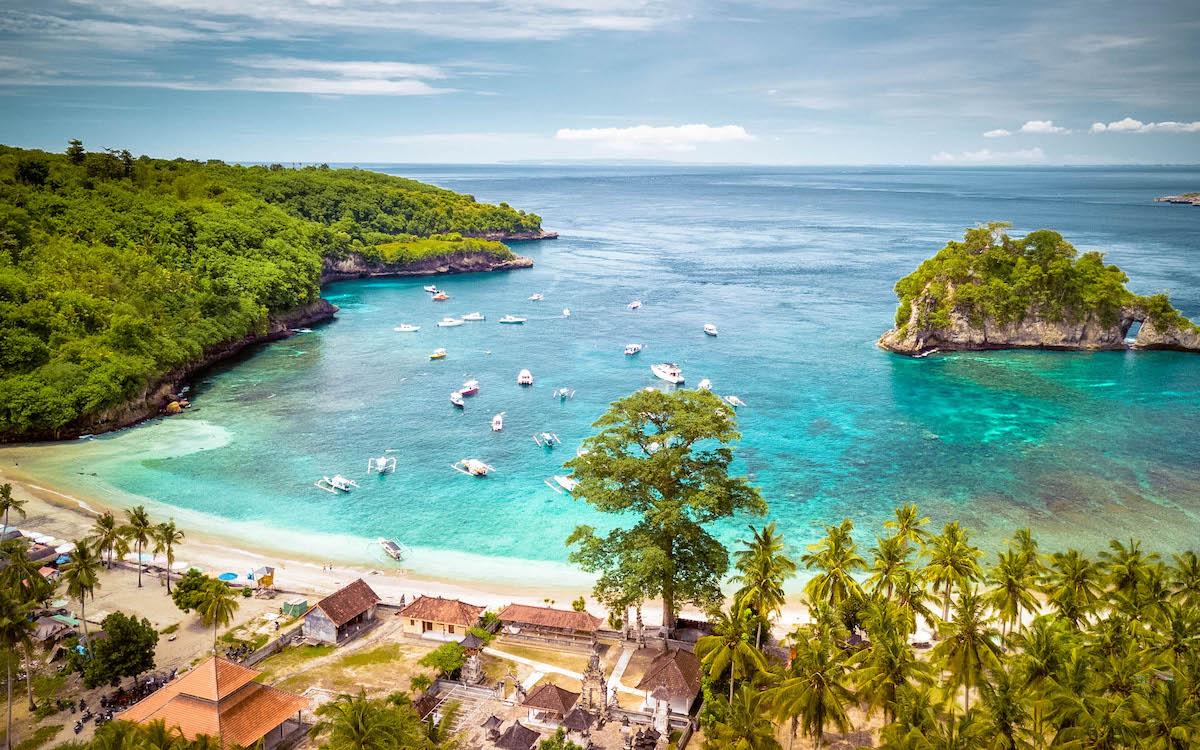
Spiaggia famosa con palme che offre spettacolari tramonti balinesi e snorkeling.
Famous beachside bar known for live music, sunset views, and signature cocktails.
Popular day club featuring a large pool, relaxed atmosphere, and international DJ sets.

Premium beach club near Toyapakeh harbor with direct beach access and luxury daybeds.

Iconic sunset destination offering panoramic ocean views and private bamboo nests.